
 United Kingdom
The United Kingdom in Charts
A complete portrait of Britain built from our database — the oldest prices in the world, the smoke that started an industrial age, the people and what they produce, the money and what it buys, the debts the country carries, who owns it, and where it sits in its own long cycle.
by Game Of Francs Research Team
I. The Oldest Prices
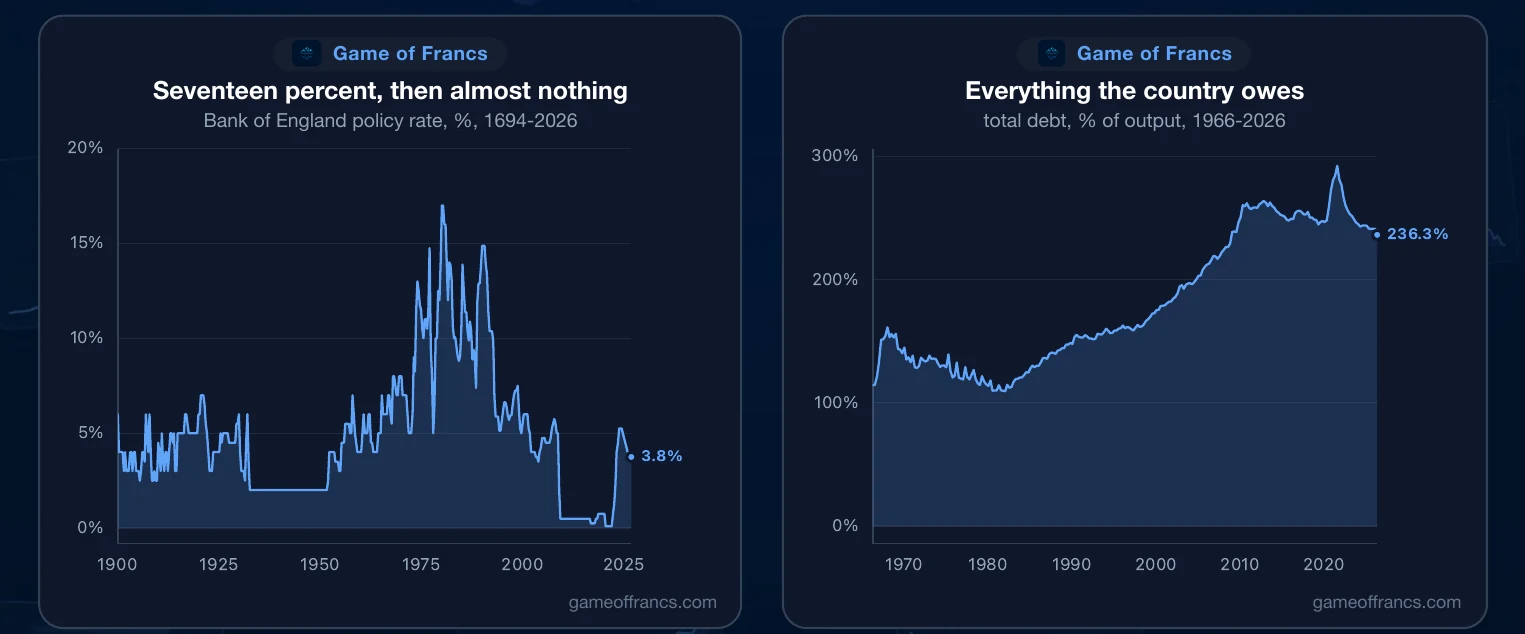
In October 1694 a new bank in London set its lending rate at 6%. It has published a rate every year since, and that single series is the spine of this portrait: 5% through the Napoleonic wars, 5% in 1914, 2% through the Second World War, 17% in November 1979 — the highest in three centuries — and 0.1% in March 2020, the lowest ever recorded. Today it is 3.75%.
Read as one picture it is three hundred years of British monetary policy in three movements: a stable band between 2% and 6% for two and a half centuries, one violent inflationary spike, and then a forty-year fall to almost nothing.
The pound tells the same story with the opposite sign. Sterling bought $4.56 in 1791 and $4.93 in 1914 — a century of war, empire and industrial revolution with no net change at all, because the pound was gold and gold does not move. Then it breaks: $4.54 in 1931, the year Britain left the gold standard; $4.03 in 1945; $1.81 in 1976, the year the country borrowed from abroad to defend it; $1.05 in February 1985, the weakest it has ever been. Today, $1.34.
II. The Smoke
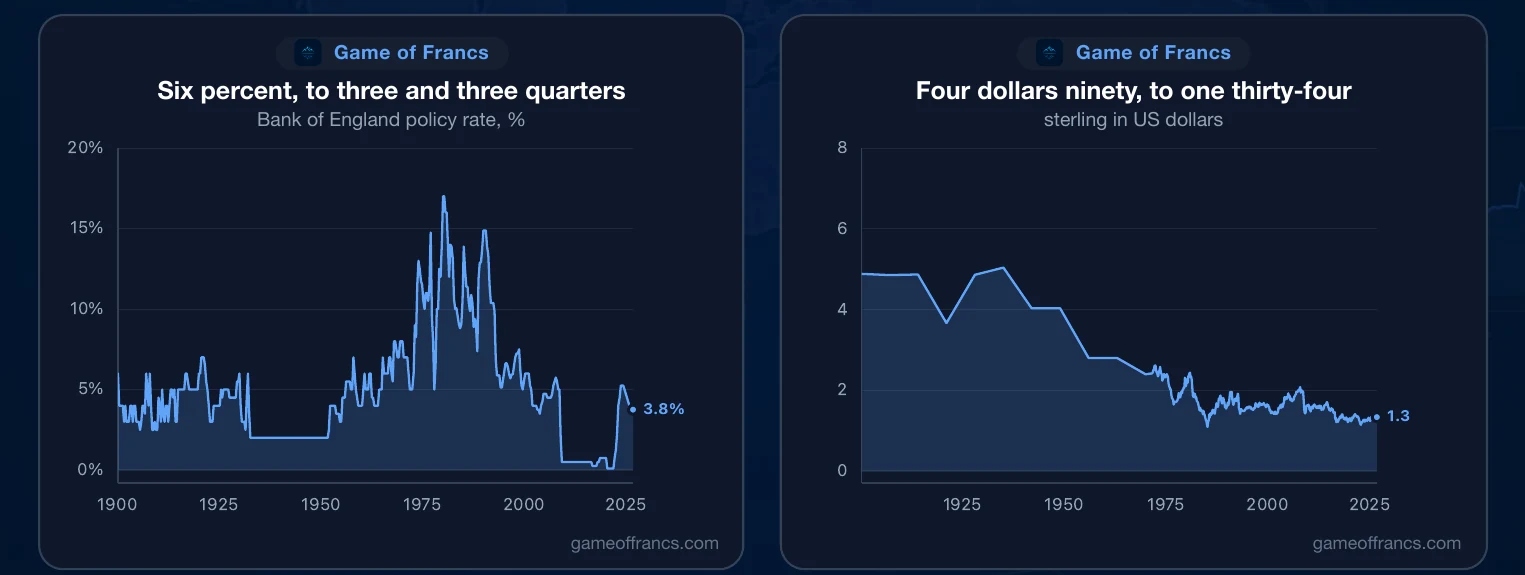
Britain put 9.3 million tonnes of carbon dioxide into the air in 1750 — almost all the industrial emissions on earth at the time, from a country of a few million people. That figure rose for 220 years and peaked in 1971 at 660 million tonnes. It is 313 million now, less than half the peak and back to roughly where it stood in 1900.
Per person the shape is stranger still. A Briton was responsible for one tonne a year in 1750, 11.8 tonnes at the 1971 peak, and 4.5 tonnes today — lower than at any point since 1853. The first industrial nation has been de-industrialising, in carbon terms, for fifty years.
III. The People
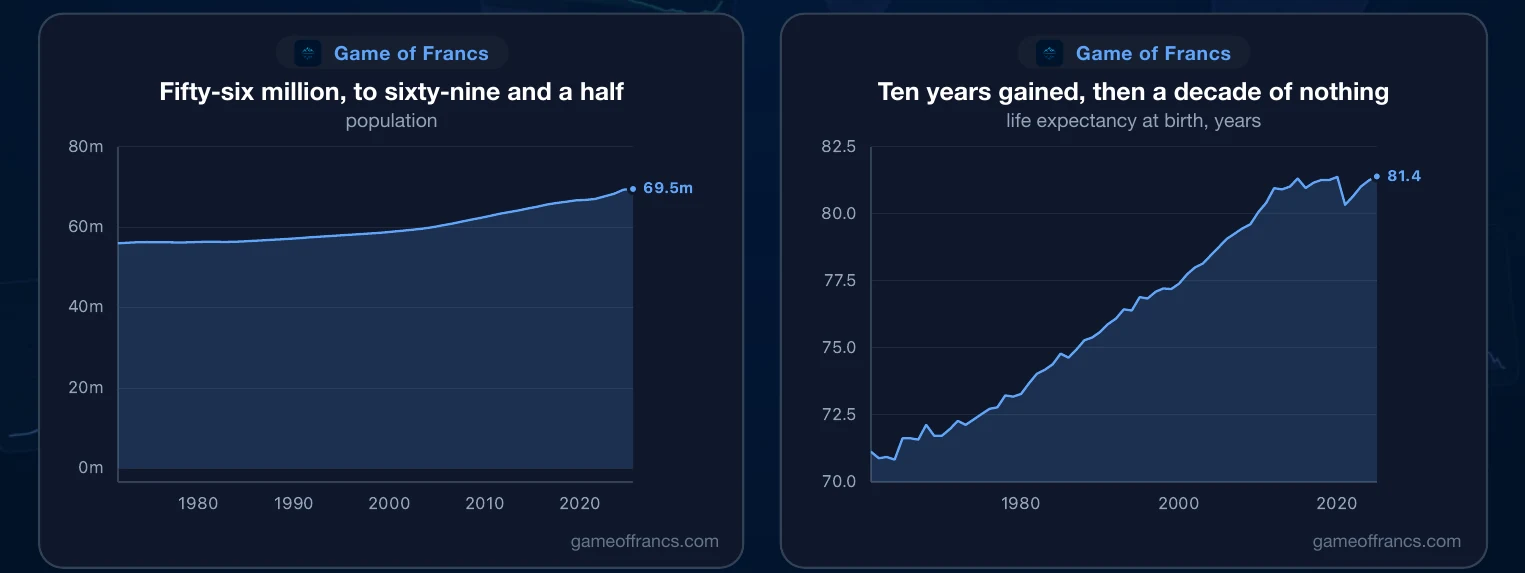
The population was 55.9 million in 1971 and is 69.5 million now: an increase of a quarter in half a century, almost all of it since 2000.
Life expectancy at birth went from 71.1 years in 1960 to 81.4 today. Almost all of that gain was banked before 2011; the 2010s were the flattest decade in a century, and the line has barely moved since.
IV. What a Briton Produces
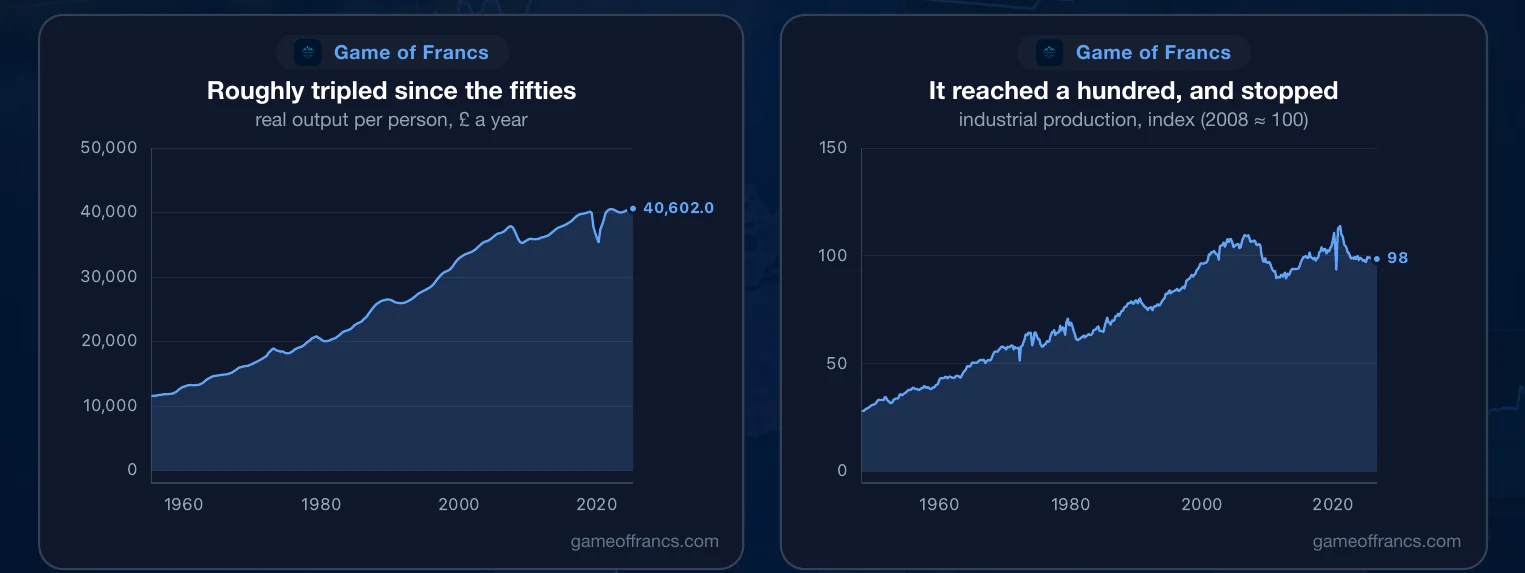
Real output per person has roughly tripled since the mid-fifties, from £11,554 a year in 1955 to £40,602. That is the single best measure of how much richer the country has become, and it is the one most people would not guess.
What Britain makes is a different story. Industrial production stood at 28 in 1948 on an index where 2008 is about 100. It reached that level, and then stopped: the index is 98.5 today. Britain makes roughly what it made two decades ago, in an economy that is substantially larger — which is another way of saying the growth happened somewhere else, in services.
V. Prices and Houses
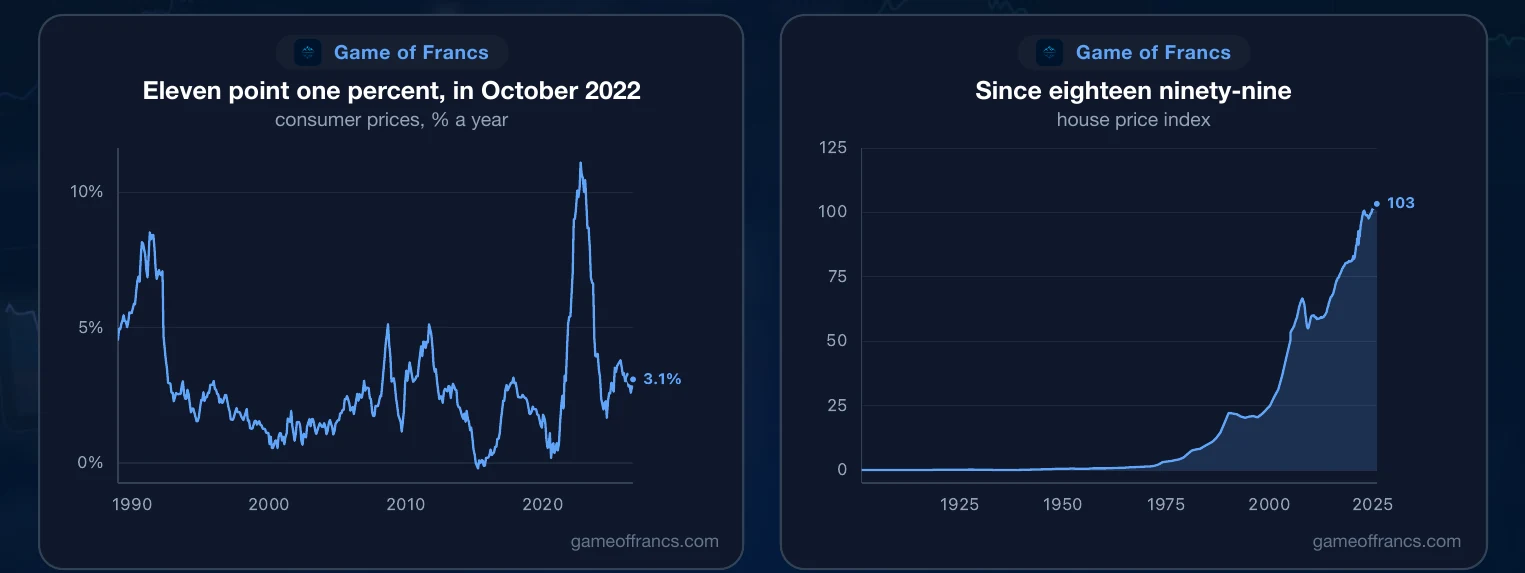
The modern inflation record starts in 1988, when consumer prices rose 4.6%. They settled into a 2% world for two decades, then reached 11.1% in October 2022, the highest in forty years. They are rising at 3.1% now, and the price level itself is nearly three times its 1988 level.
Housing is where the British argument lives, and it can be followed back to 1899. House prices rose 36.7% in a single year in 1973 and fell 16.3% in 1929. Since the war they have risen almost without interruption, and the index is now more than 700 times its 1899 level in cash terms.
VI. Work
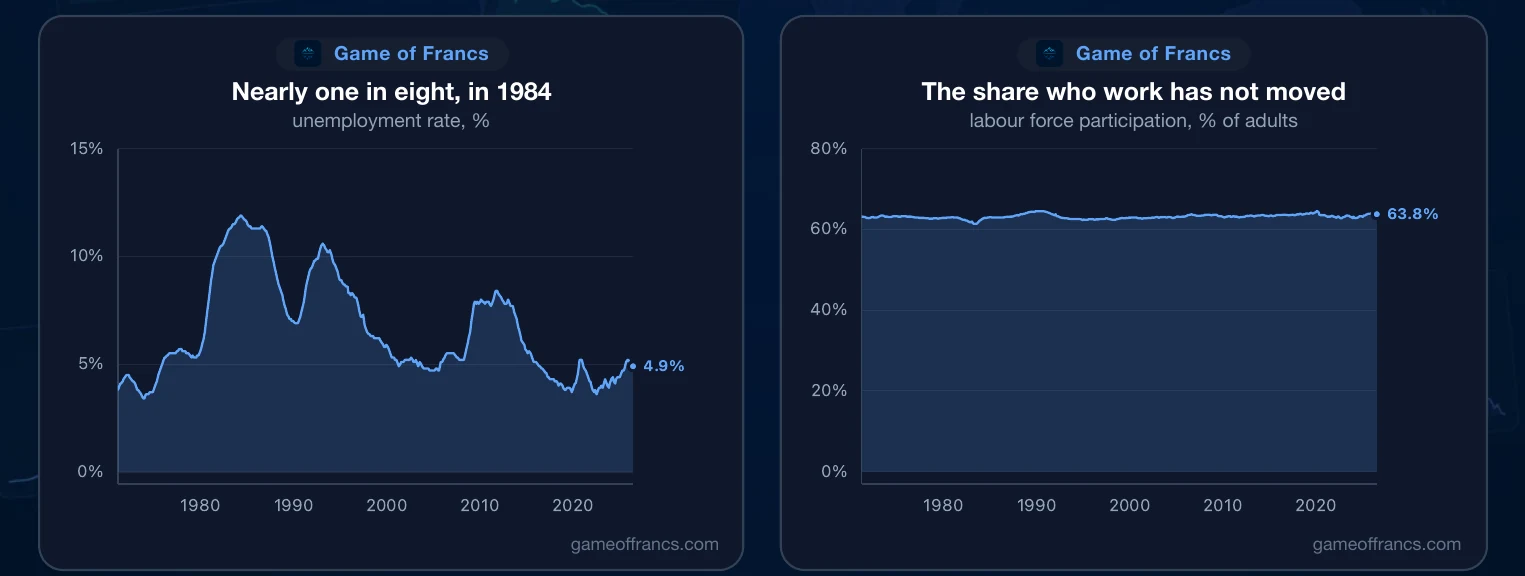
Unemployment was 3.8% in 1971, 11.9% in March 1984 — the deindustrialisation years — and 4.9% today. The share of adults in the labour force has barely moved in fifty years: 63.2% in 1971, 63.8% now, with a low of 61.4% in 1983. Whatever changed in the British economy, it did not change how many people work.
VII. What the Country Owes
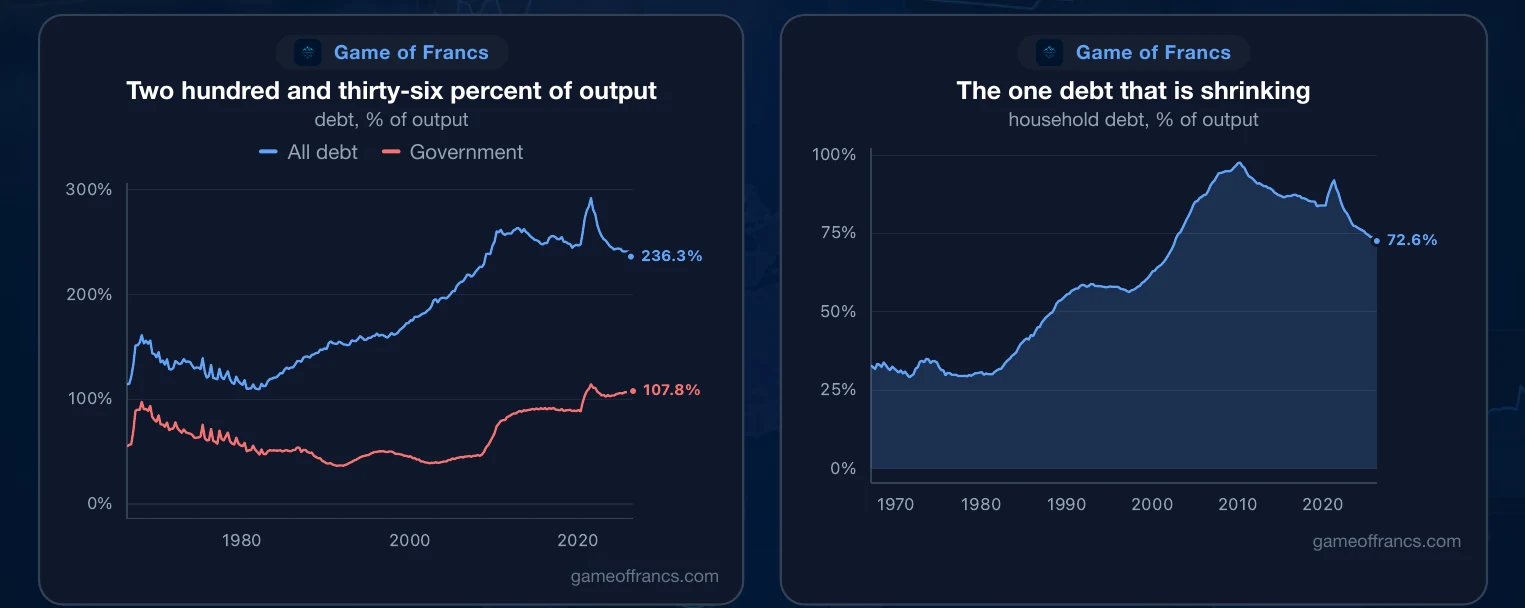
Total debt in the British economy — government, households and companies together — was 114% of output in 1966. It peaked at 292% in June 2021 and is 236% today. Government debt alone went from 55% of output in 1966 to 114% at the 2021 peak and is 108% now, twice its level before the financial crisis.
Household debt is the exception, and the only one. What British households owe went from 33% of the economy in 1966 to 97.6% in March 2010, and has fallen back to 72.6%. It is the single large British debt that is smaller than it was.
VIII. The State
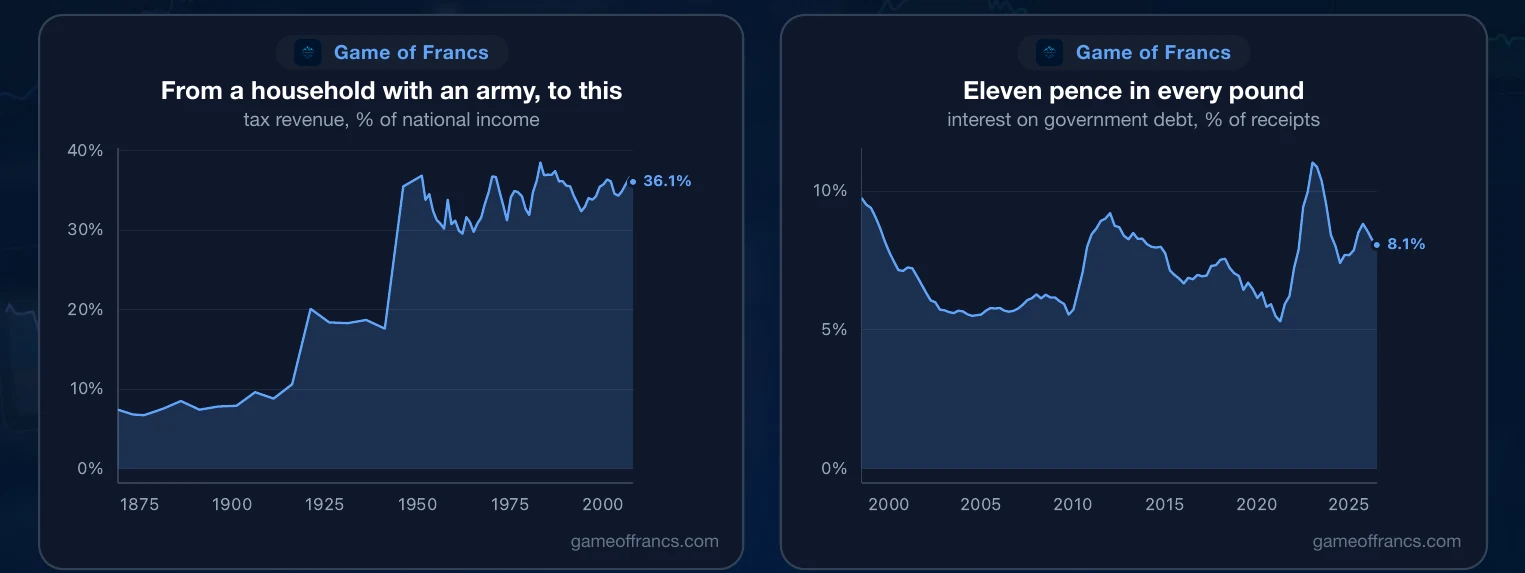
The English crown took 0.6% of national income in 1274. It took 10% in 1914, 35.5% by 1945, and 36% by 2007, where that series ends; on the broader measure of all government revenue it is 38% of output today. That is the clearest measure of what a state became: from a household with an army to the largest economic actor in the country, in seven hundred years. The record has one hole in it, between 1691 and 1868, and this portrait leaves it empty rather than drawing a line through it.
Interest on the debt is the part that bites. It took 11 pence of every pound the government collected in December 2022, the quarter the gilt market broke, against 9.8 pence in 1998. It takes 8.1 pence now.
IX. Who Owns Britain
This is where Britain has changed most, and where almost nobody says so.
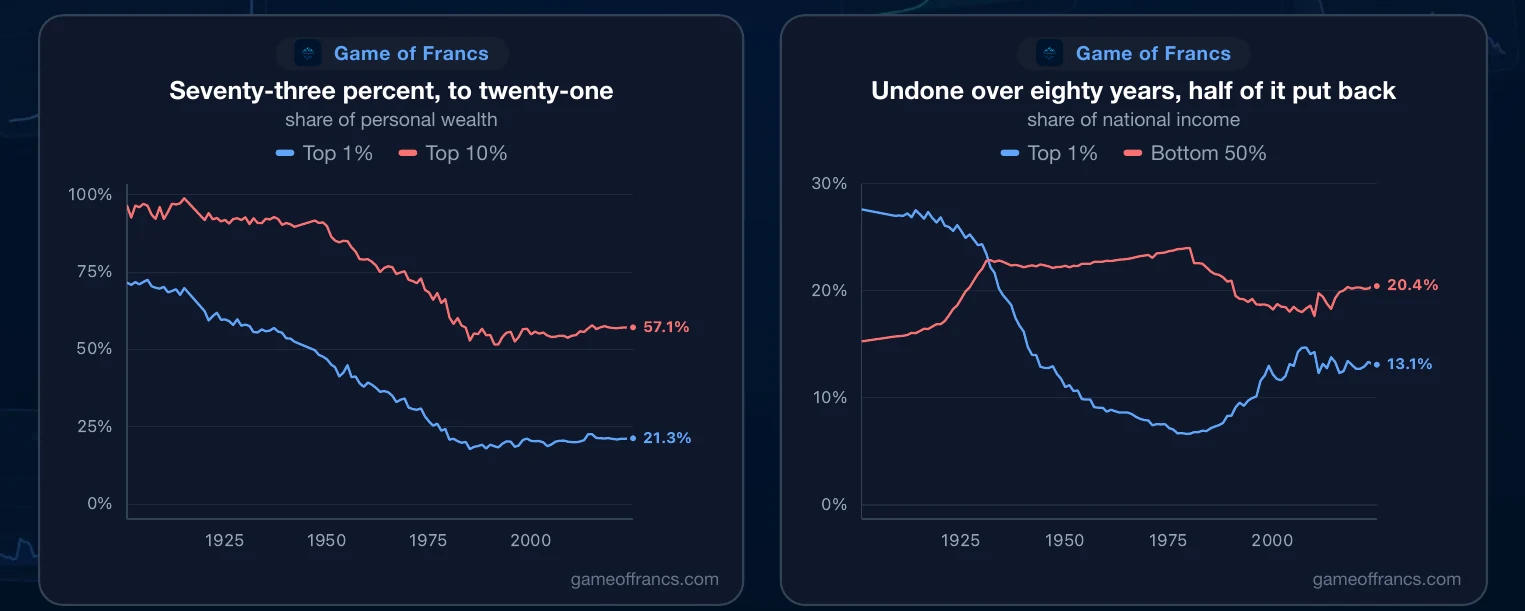
In 1896 the richest 1% of Britons owned 72.9% of the country's personal wealth. The top 10% owned 98.8% of it by 1914 — a society in which ninety of every hundred people owned essentially nothing. The top 1% share fell for ninety years to 17.8% in 1984. It is 21.3% today, and the top 10% hold 57.1%, against a low of 51.6% in 1990.
Income went the same way and then turned around. The top 1% took 27.6% of all income in 1900 and 6.6% in 1978 — the most equal year Britain has known — and 13.1% now. The bottom half took 16.6% in 1820, 24% at the 1979 peak, and 20.4% today. Britain undid its Victorian inequality over eighty years, and has spent the last forty putting half of it back.
What the country has accumulated is the other side of that ledger: British private wealth was £373 billion in 1800 and is £17.9 trillion now, having peaked at £18.7 trillion in 2021.
X. Britain and the World
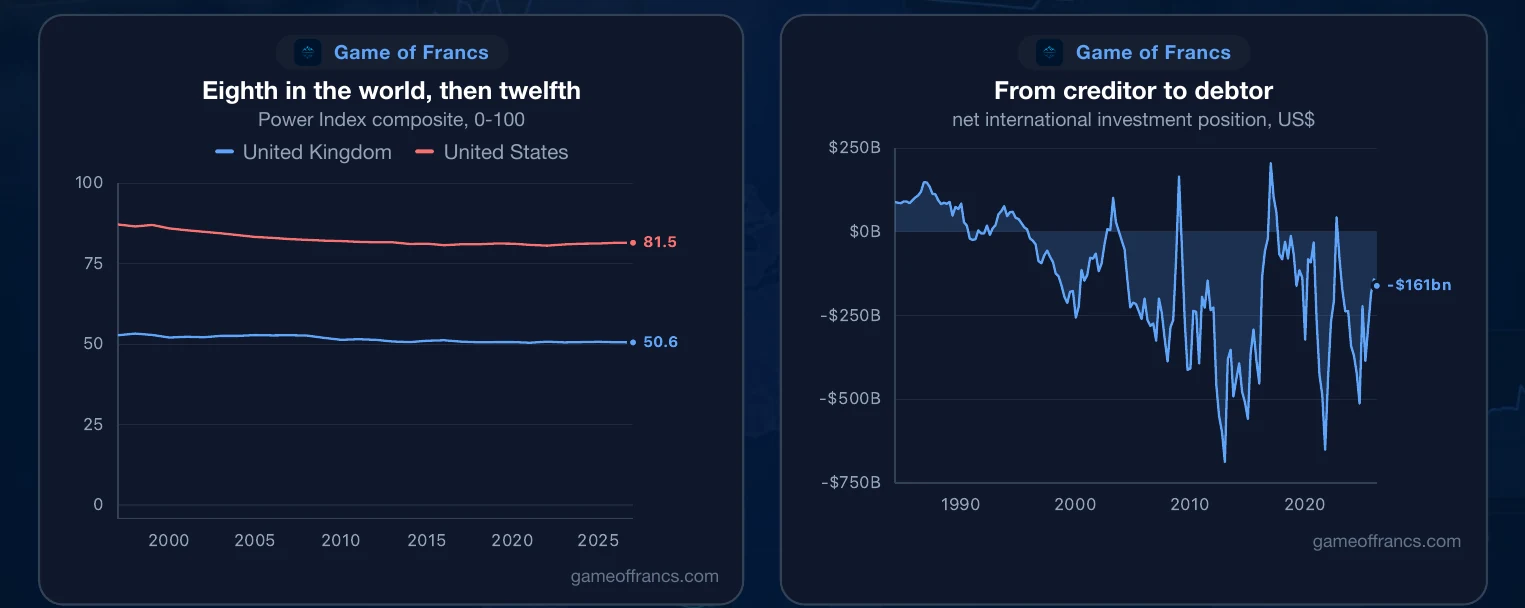
Our Power Index scores output, trade, military strength, innovation, reserve-currency status and governance together. It ranked the United Kingdom 8th in the world in 1997 and ranks it 12th today. The trade score has fallen by more than a quarter since its 1997 high. The reserve-currency score — whether the world still saves in your money — has nearly doubled from its 1996 low.
The balance sheet with the rest of the world has flipped. Britain owned $88 billion more abroad than foreigners owned in Britain in 1984. It owns $161 billion less today. The country that financed the world is financed by it.
XI. Where Britain Is Now
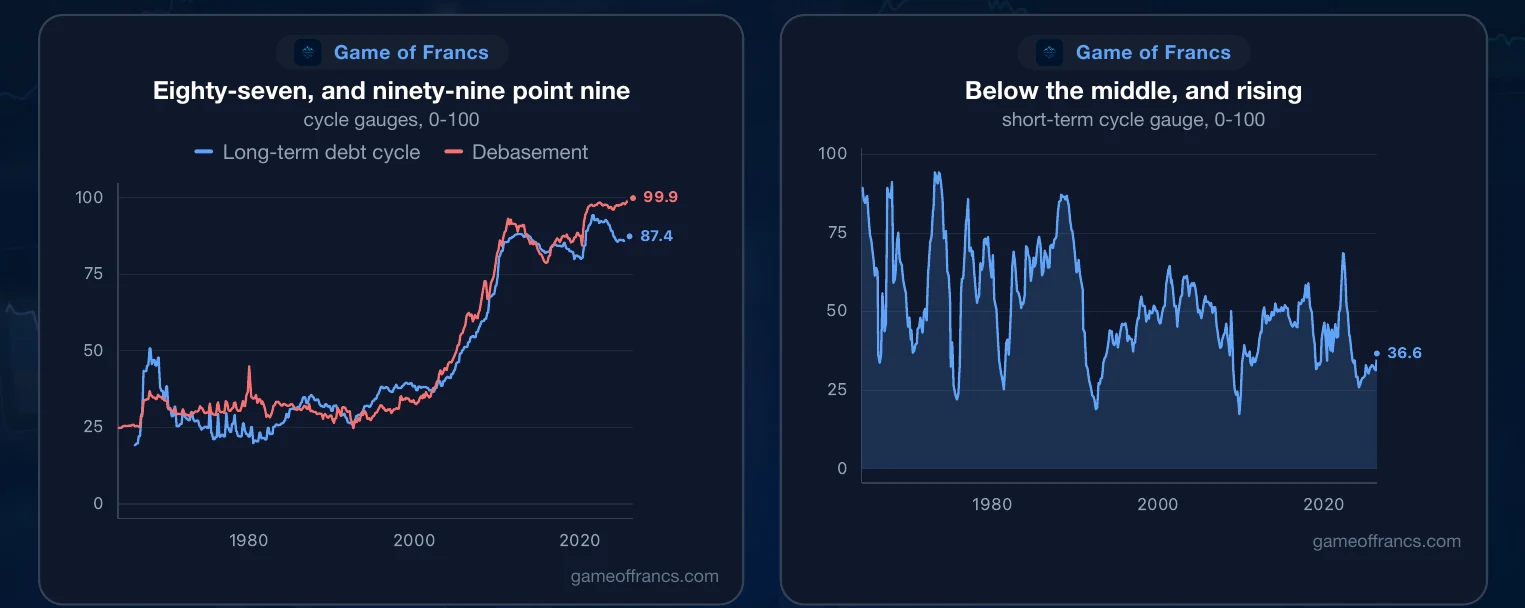
Three gauges place Britain against its own whole record, on a scale of 0 to 100 where 100 means never higher.
The long-term debt cycle reads 87. It has not been below 80 since 2019 and peaked at 94 in June 2021. Britain has been more leveraged than it is now in only 9% of the months since 1966, and every one of those months came after the financial crisis.
Debasement — what money, credit and asset prices have done to the value of a pound — reads 99.9. It has been above 95 every month since September 2020.
The short-term cycle reads 37, against 30 a year ago: below its own middle and rising, with growth soft and inflation not. Fiscal stimulus reads 75, so the state is still pushing.
Britain has counted its taxes since the thirteenth century, and has never owed more than it does today.
 United KingdomEconomic Cycle
Get the next article by email
One email when a new piece is published. Nothing else, and one-click unsubscribe from any message.