
Japan in Charts
A complete portrait of Japan built entirely from our database — the land and the people, how it got rich, the bubble and the bust, what it makes now, its trade and its energy, the state's balance sheet, and where it stands against every other country and inside its own economic cycle.
by Game Of Francs Research Team
I. The Land and the People
Japan is an archipelago off the eastern edge of Asia, and the first thing to understand about it is how little of it people can actually use. 68% of Japan's land area is forest, one of the highest shares in the developed world. The mountains that make it beautiful also mean that 123 million people are pressed into the narrow coastal plains between them.
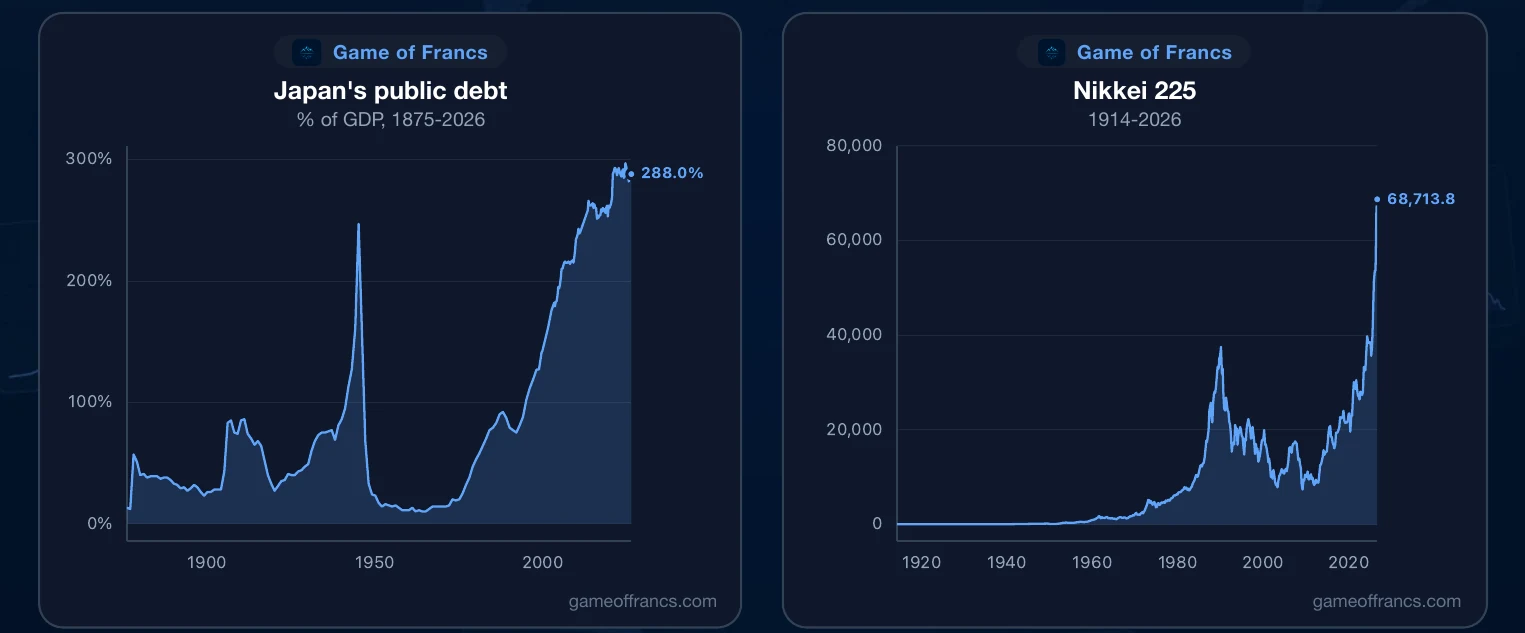
That population is the central fact of modern Japan. In 1870, when the country began keeping modern statistics, 34 million people lived there. It grew almost without pause for 140 years, peaking at 128.1 million in 2010.
And then it turned. Japanese population growth ran as high as 2.2% a year in 1971. It crossed below zero in 2009 and has stayed there. The population is now shrinking by roughly half a percent every year.
The reason is visible in a single ratio. In 1960, for every 100 Japanese under the age of 20 there were 9 people over 70. Today there are 152. Japan now contains substantially more people over 70 than under 20 — the first large society in history to be shaped like that.
Births are the numerator that failed: Japan's birth rate has fallen from 9.5 per thousand people in 2000 to 5.7 today. At the other end of life the news is entirely good — Japanese life expectancy has risen from 67.7 years in 1960 to 84.0 today, among the very highest recorded anywhere.
There is one quiet countercurrent, and it is larger than most people realise. Net migration into Japan — a country famous for closing itself — has risen roughly sixfold this century, from about 23,000 people a year in 2000 to 141,000 now.
II. How Japan Got Rich
For most of the twentieth century Japan did something no non-Western nation had managed: it got rich. Real output per person multiplied many times over within a single working lifetime, turning a country bombed flat in 1945 into the world's second largest economy.
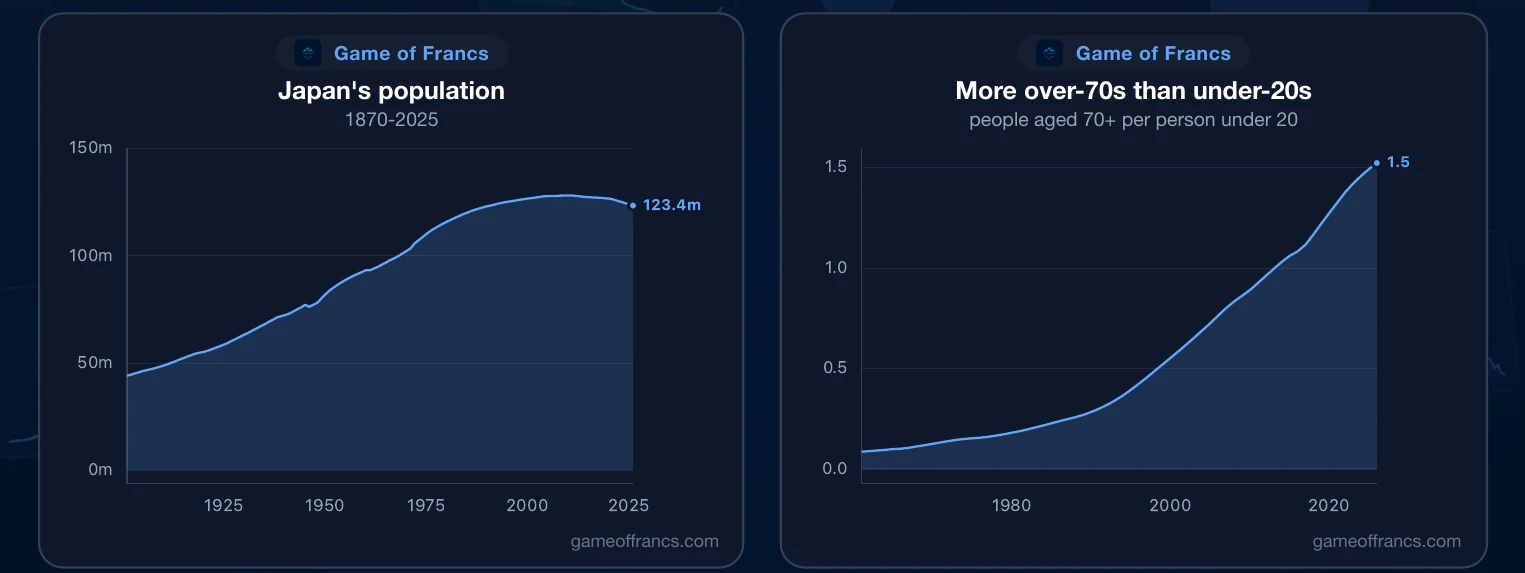
That achievement has a measurable ceiling, and Japan has been descending from it for thirty years. Japan's share of world output, measured at purchasing power parity, peaked at 8.9% in 1991. Today it is 3.3% — a share cut by nearly two thirds, not because Japan shrank but because the rest of the world grew faster.
The fuel was savings. Japanese households put aside 22% of their disposable income at the peak in 1974 — an extraordinary rate, and in a closed financial system that money had only one place to go. That household thrift is now gone: the rate today is essentially zero. But Japan as a whole still saves 31% of its output. The saving simply moved from households to companies and the state.
It went through the banks into companies. Credit to Japanese corporations rose from about 91% of the economy in the mid-1960s to 145% by 1993, making Japanese industry among the most heavily leveraged on earth.
What that capital built changed shape over time. In 1970, manufacturing alone was 34% of Japanese output and agriculture was 5%. Today manufacturing is 20%, agriculture is under 1%, and the broad service economy has swollen from 23% to 45%. Exports roughly doubled as a share of the economy over the same span, from 10% in 1970 to 22% today — the highest on record.
III. The Bubble and the Bust
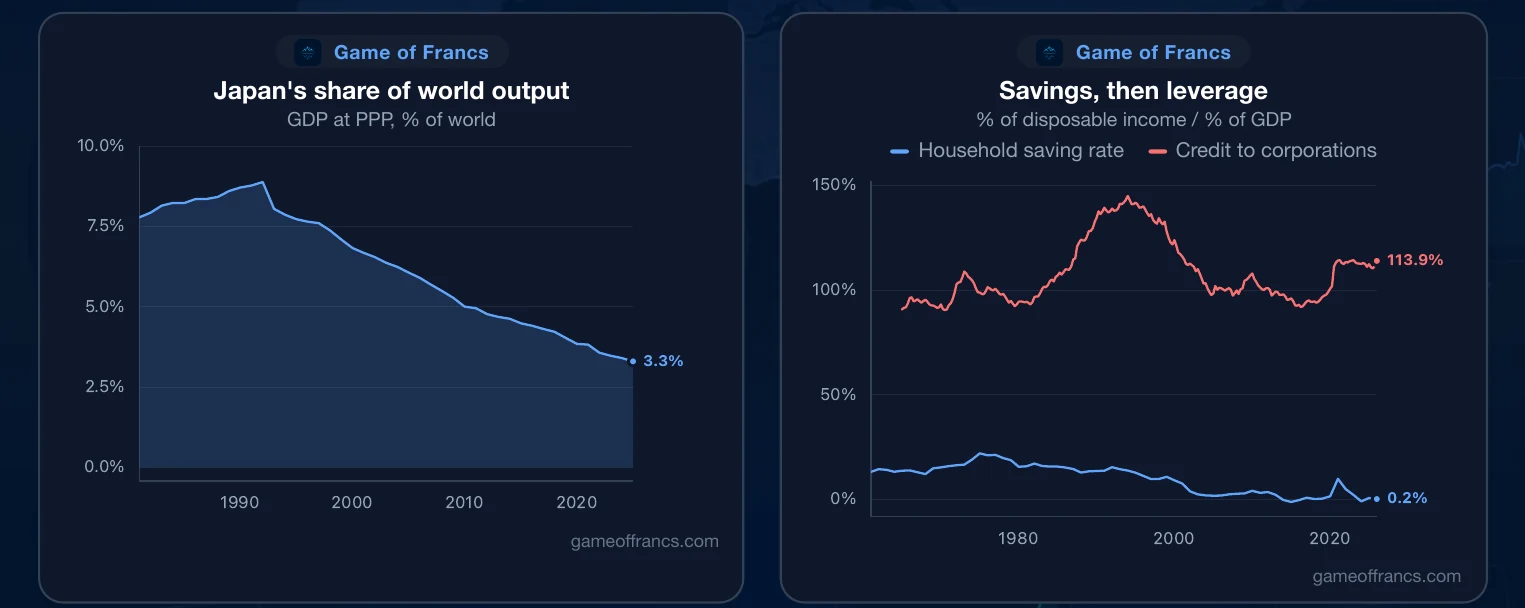
Then came the part everybody knows. The Nikkei 225 closed 1989 at 38,916, having climbed from under 23 points in 1914. It would not see that level again for 34 years, finally reclaiming it in February 2024. It now trades in the 60,000s.
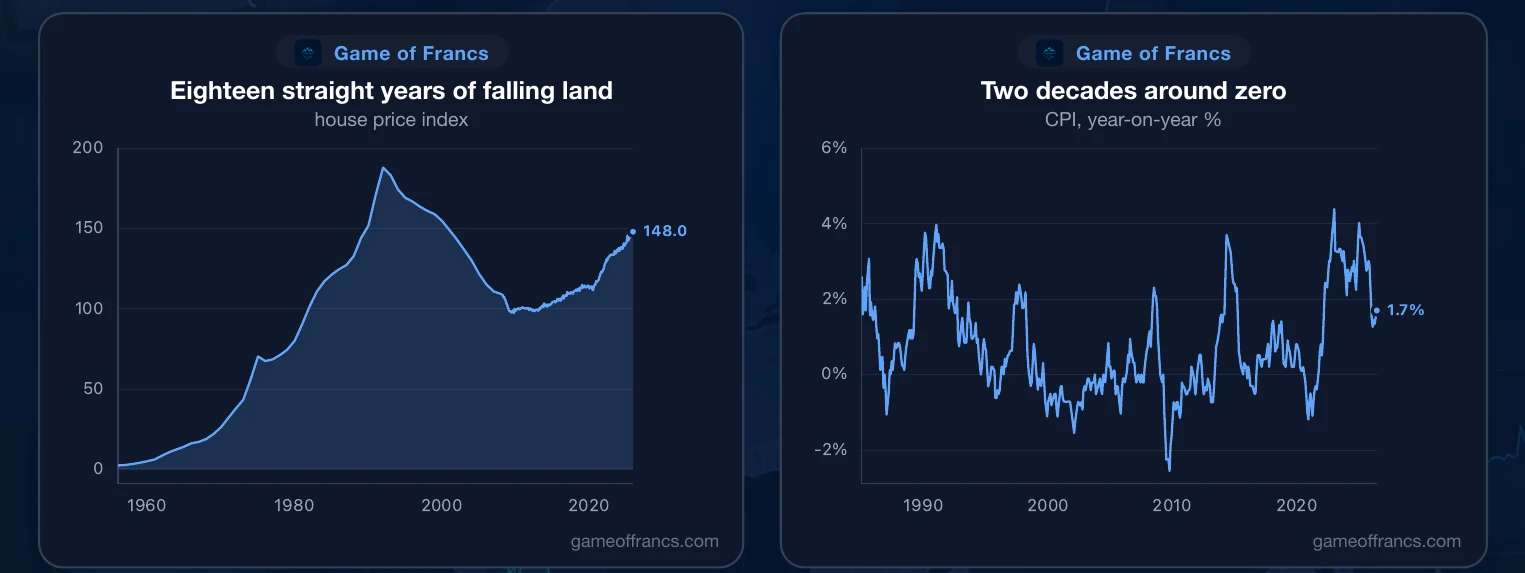
Land did the same thing. Japanese house prices peaked in 1991 and then fell, without interruption, for 18 years — down 48% by 2009. They have recovered since, but remain roughly a fifth below the 1991 high.
The human cost is easiest to read in the unemployment rate. Japan began the 1980s with unemployment around 2%, effectively full employment. It climbed through the 1990s to peak at 5.8% in April 2003. Today it is back to 2.5% — low by any international standard, and one of the reasons the lost decades were survivable at all.
Prices went the other way. Japan spent the better part of two decades in and around deflation, bottoming at −2.6% in 2009 — the condition every other central bank spent the following decade trying to avoid.
Companies responded by paying down debt rather than borrowing. Private sector debt fell from 214% of the economy in 1994 to 175% today: thirty years of deleveraging.
IV. What Japan Makes Now
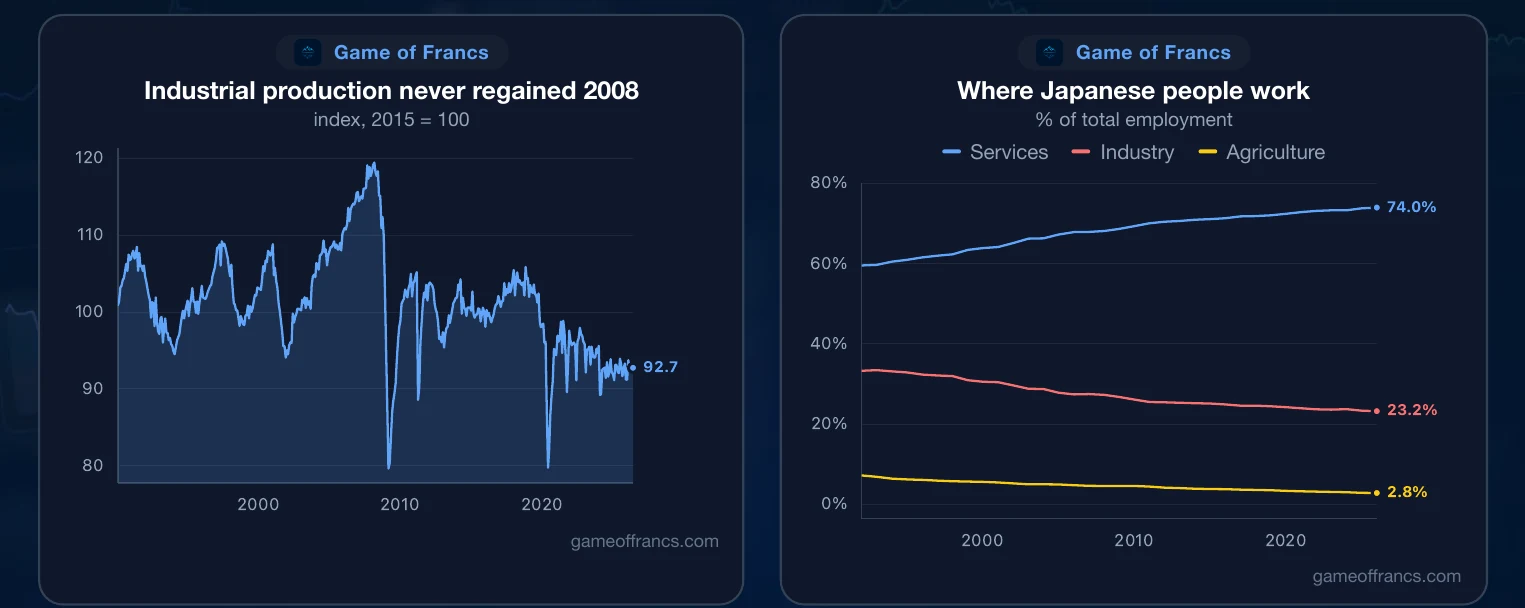
Less than it used to, in physical terms. Japanese industrial production peaked in February 2008 and has never regained it; it currently sits about 22% below that high.
Productivity is the deeper issue. Output per Japanese worker has risen from about $70,000 in 1991 to $88,000 today — a 25% gain spread over 34 years, respectable in level and very slow in growth. Total capital expenditure has drifted from 32% of the economy in 1994 to 28% today, though its composition has modernised: ICT equipment has gone from under 4% of all investment to over 6%, and intangible assets — software, data, intellectual property — now account for almost a third of everything Japan invests in.
The workforce followed the output. In 1991, a third of Japanese workers were in industry and 7% were in agriculture. Today industry employs 23%, agriculture under 3%, and services account for very nearly three quarters of all Japanese jobs.
One thing has grown steadily throughout. The number of companies listed on Japanese exchanges has risen from under 1,400 in 1975 to nearly 4,000 today. Through the bubble, the bust and the lost decades, Japan's public market kept getting broader — the opposite of the shrinking listed universe seen across much of the West.
V. Japan and the World
The trade surplus that defined Japan in the 1980s is gone. Japan's goods and services balance peaked around 2% of the economy in 1998, swung to a 4% deficit in 2022 when energy prices spiked, and today sits at roughly zero.
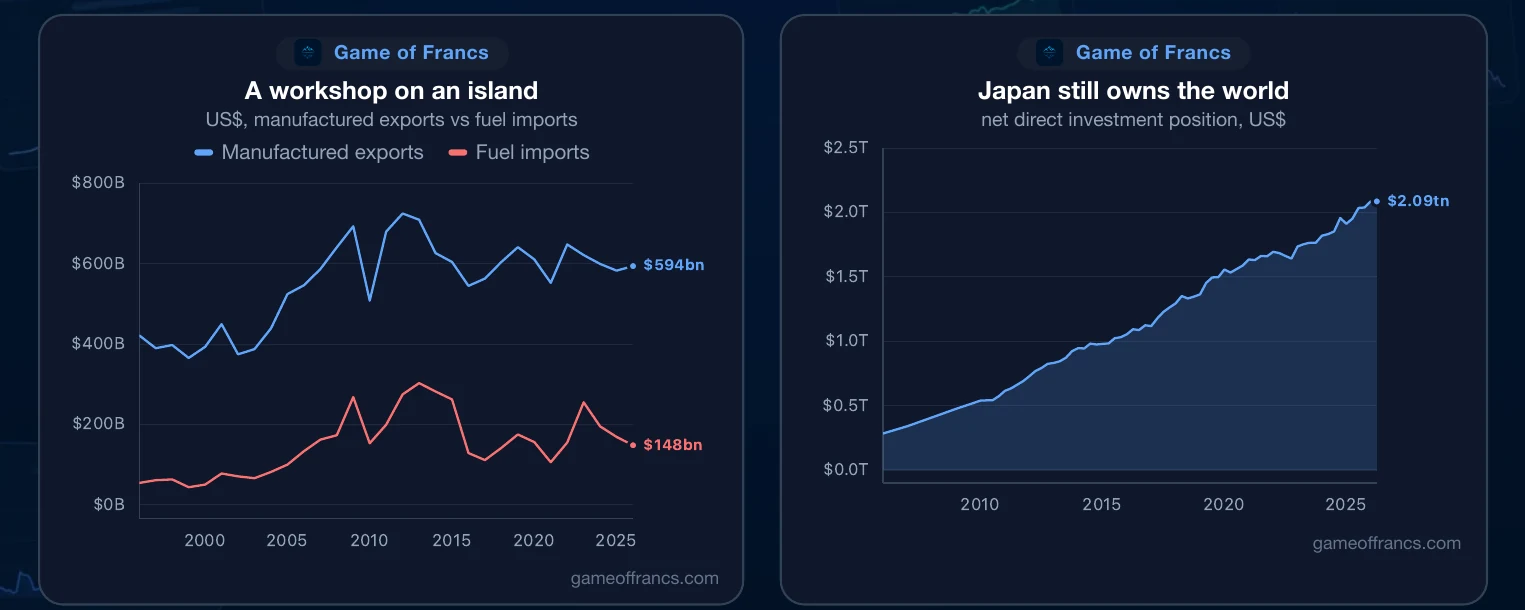
The reason is structural. Japan exports manufactured goods — some $594bn of them last year. But it must import almost all of its energy: $148bn of fuel, plus $74bn of food. Japan is a workshop built on an island with almost nothing underneath it.
And yet the current account remains firmly in surplus — nearly $194bn, close to 5% of the economy. Japan no longer earns that from trade. It earns it from what it owns. Over decades of surpluses Japan bought the world: net direct investment abroad now stands at over $2 trillion. Japan is one of the largest creditor nations on the planet, and the income on those foreign assets is what now pays its way.
VI. Energy, and Fukushima
Japan's primary energy supply tells the story of six decades of substitution. Oil provided over 3,270 TWh in 1973; today it provides under 1,790. Gas has gone from 53 TWh to over 900. Coal has nearly doubled. And solar, which did not exist in Japan in the 1970s, now supplies more energy than either hydro or nuclear.
Then, in March 2011, an earthquake and tsunami struck the Fukushima Daiichi plant. What followed is often misdescribed, so it is worth being precise. Japan did not demolish its reactors. It idled them. The fleet shrank slowly — 54 reactors in 2010, 50 by 2012, 43 by 2016, and 33 today, a reduction of nearly 40% spread across fifteen years.
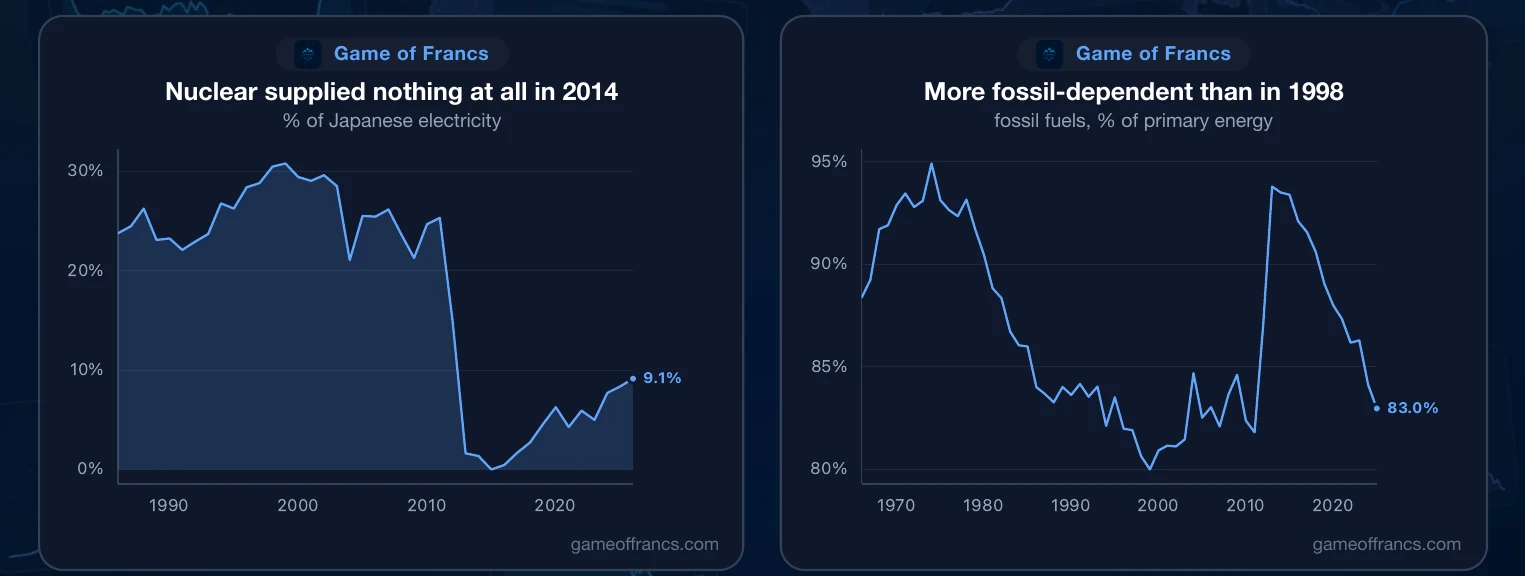
What collapsed immediately was not the fleet but its output. Nuclear supplied a quarter of Japanese electricity in 2010. Two years later it supplied 1.6%. In 2014 it supplied nothing at all — an entire national power source, idle for a year. It has since recovered to just 9%, against a peak of nearly 31% in 1998.
Someone had to make up the difference, and it was fossil fuels. 83% of Japan's primary energy today comes from fossil fuels — a higher share than in 1998, when it reached its low of 80%. On this measure Japan has gone backwards for a quarter of a century.
What has genuinely improved is efficiency. Japanese energy intensity — the energy required per unit of output — has fallen by roughly three quarters since 1973. Japan produces vastly more with each unit of energy than it once did, which is why emissions have fallen almost 27% from their 2013 peak despite the nuclear shutdown.
VII. Money and Markets
The Bank of Japan held its policy rate as high as 9% in the 1970s. It cut through the 1990s, reached zero, and then went below it, bottoming at −0.08% in 2016. It is now back near 1% — the first genuine tightening cycle in a generation.
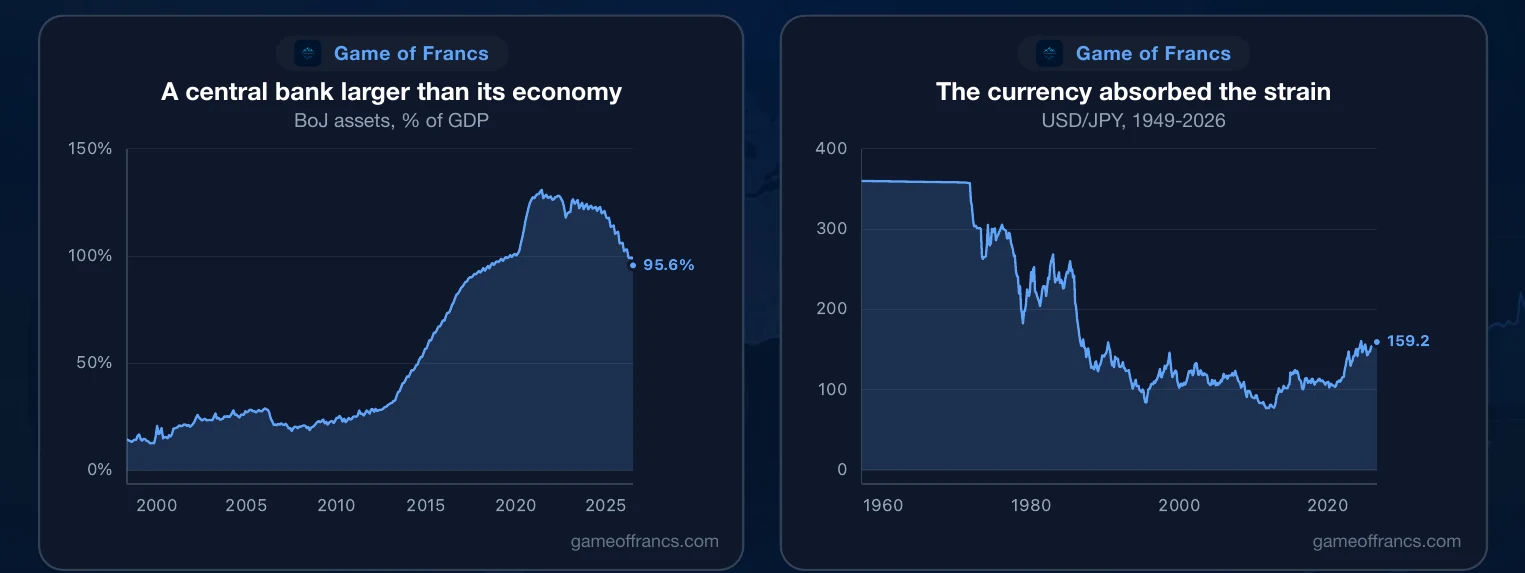
To hold rates down for that long, the central bank had to buy. Bank of Japan assets rose from 14% of the economy in 1998 to a peak of 131% in May 2021. No major central bank has ever owned so much relative to the economy it serves. It is now shrinking, at 96%.
Bond yields tell the same story from the other side. The 10-year Japanese government bond yielded nearly 15% at its 1961 high. In July 2016 it yielded −0.3%. Today it yields 2.8%, and the 30-year sits near 4% — the highest in the history of that series.
The currency absorbed the strain. The yen was pinned at 360 to the dollar under Bretton Woods, strengthened all the way to 76 by 2011, and has since fallen back to around 160. Measured against that currency, real assets have done what real assets do: property, gold and commodities have roughly doubled relative to Japanese financial assets since the 1989 peak.
VIII. The State, and the Debt
Japanese public debt stands at 288% of the economy — the highest in the developed world. It is not the first time. In 1944, financing total war, it reached 247%.
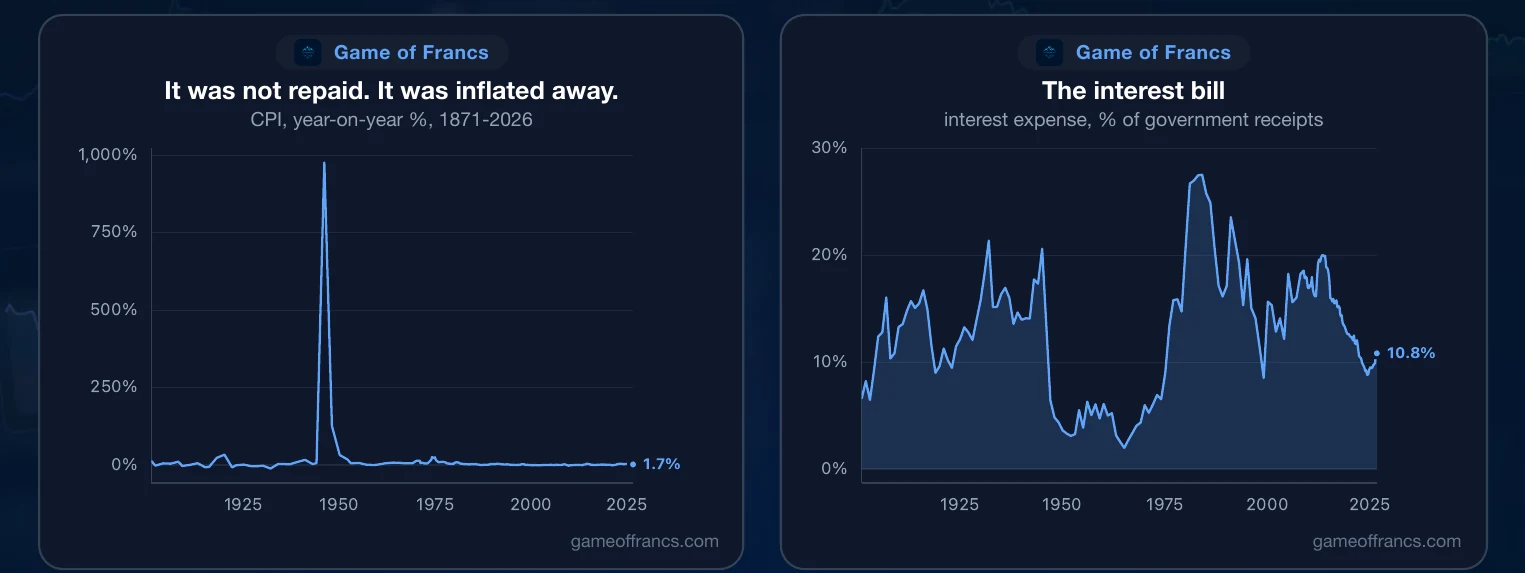
Japan escaped that debt in the most brutal way available. In 1945 Japanese consumer prices rose 976% in a single year. Five years later public debt was 17% of the economy. It was not repaid; it was inflated away, and every domestic bondholder was wiped out.
Today's arithmetic is gentler but tightening. Interest now consumes about 11% of all government revenue — well below the 27% it reached in 1983, but rising, on a debt several times larger.
The budget itself is closer to balance than the debt figure suggests. Japanese general government spending runs at 39% of the economy against revenue of 38%. The deficit is not extreme. The stock is.
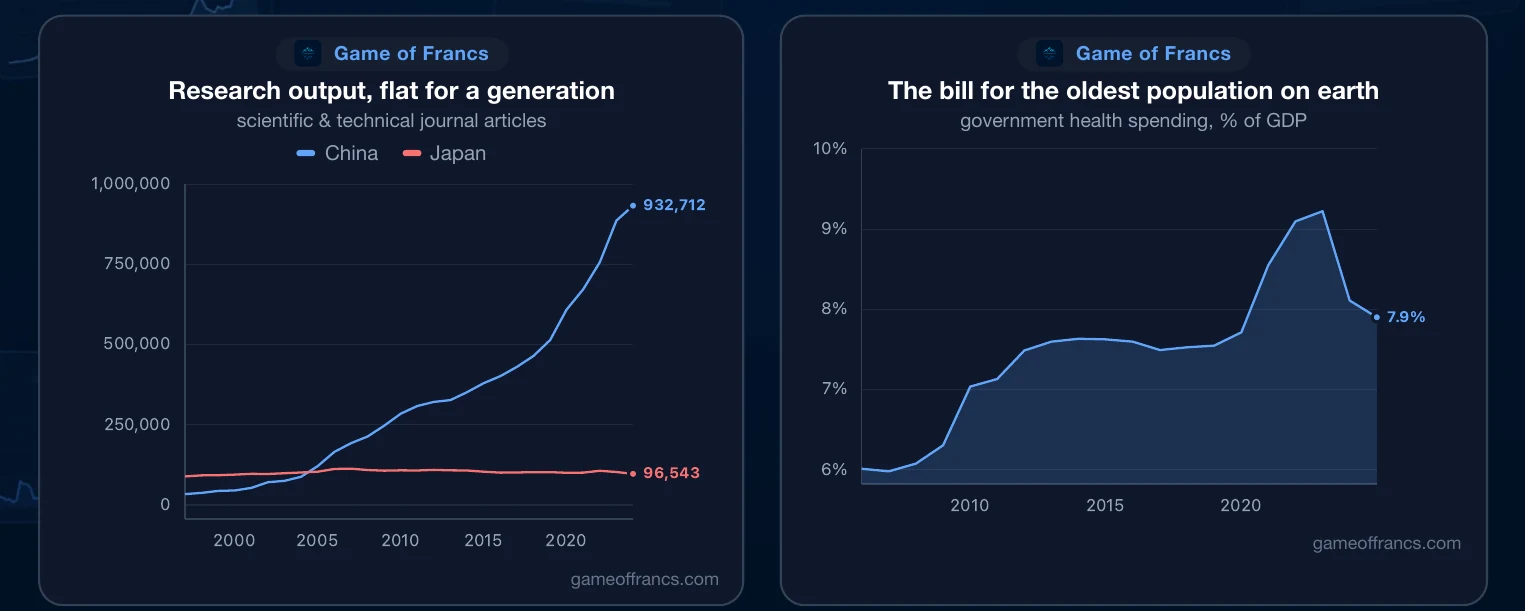
And the fastest growing line is the one demographics dictate. Government health spending has risen from 6% of the economy in 2005 to nearly 8% today. That is the bill for the oldest population on earth, and it only goes one way.
IX. Society and Knowledge
For all its problems, Japan remains one of the more equal rich countries. The top 10% of Japanese earners take just over 43% of national income and the bottom half take 18%. The comparison that really separates them is at the very top: the top 1% take under 13% of income in Japan, against nearly 21% in the United States. Absolute poverty is close to eradicated — under 2% of Japanese live below the $6.85 a day threshold.
Education is near universal and long. The average Japanese adult has completed almost 13 years of schooling, and a child starting today can expect 15.5. Japan also remains a serious research nation: it spends 3.4% of its economy on research and development, among the highest ratios anywhere, and supports over 5,600 researchers per million people.
But here is the number that should trouble Tokyo. Japanese scientific and technical journal articles numbered about 89,000 in 1996. Twenty-seven years later they number 96,500 — a gain of 9% across an entire generation. Over the very same years, China went from 34,000 to 933,000. China now publishes almost ten times as much science as Japan, from a starting point well below it.
X. National Power
So how does all of this add up, measured against every other country?
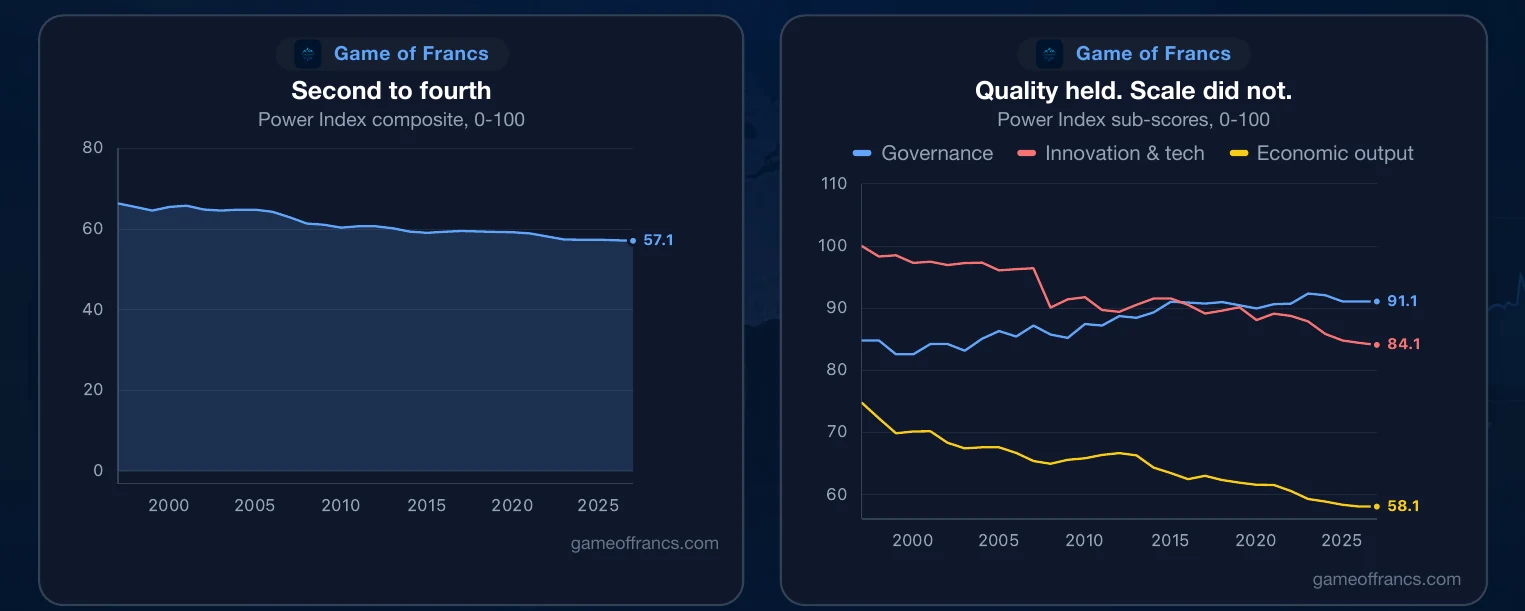
Our Power Index scores each nation on the structural determinants of national power — output, trade, military, reserve currency, reserves, population, resources, education, innovation, competitiveness and governance. Japan scored 66 in 1996. Today it scores 57: a slow, steady, three-decade decline. In rank, Japan has fallen from second in the world to fourth. It was not overtaken because it deteriorated. It was overtaken because others grew faster.
The composition is the interesting part. Japanese governance scores 91 out of 100, innovation 84, competitiveness 71. Those are elite figures. What fell was scale — economic output from 75 down to 58. And on resources Japan scores 32, on reserve currency status just 10. This is a country of very high quality and very little raw material.
XI. Where Japan Sits in Its Cycle
Our economic cycle gauge measures a country against its own history, where 50 is normal. Japan reads 41 — below par, but nowhere near the collapse readings of 16 in 1998 or 10 in 2009.
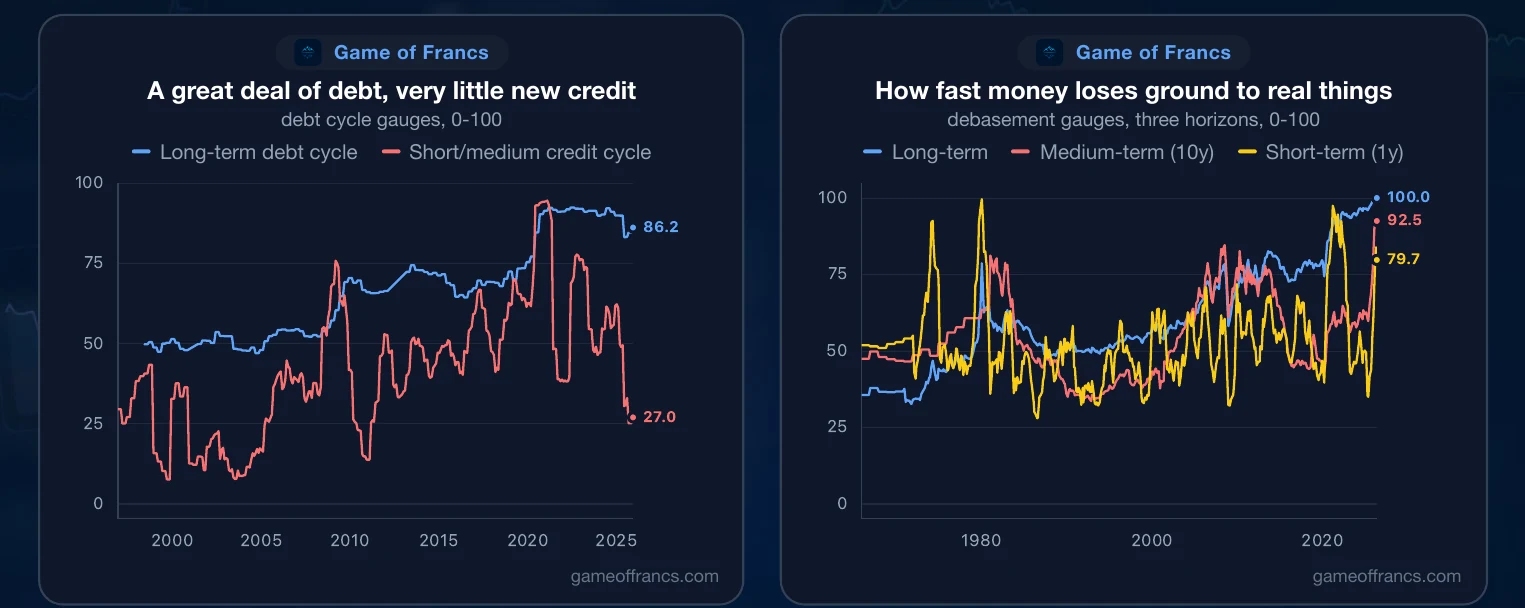
Split the debt cycle into its two horizons and the position is unusually clear. The short and medium term credit cycle reads 27: private borrowing is subdued. The long term debt cycle reads 86: the accumulated stock is near the top of its range. A great deal of debt, and very little new credit being created against it.
And debasement — how quickly the currency loses ground to real things. Over one year Japan reads 80. Over ten years, 92. Measured across the entire history of the data, 100 out of 100.
That is Japan. 123 million people on a mountainous, forested, resource-poor archipelago, who built the second largest economy on earth, lost a third of a century to a debt bust, aged faster than any society before them, and still hold some of the finest institutions, technology and foreign assets in the world — carrying the heaviest public debt of any developed nation, in a currency that has been falling for fifteen years.
 JapanEconomic Cycle
Get the next article by email
One email when a new piece is published. Nothing else, and one-click unsubscribe from any message.