
 France
France in Charts
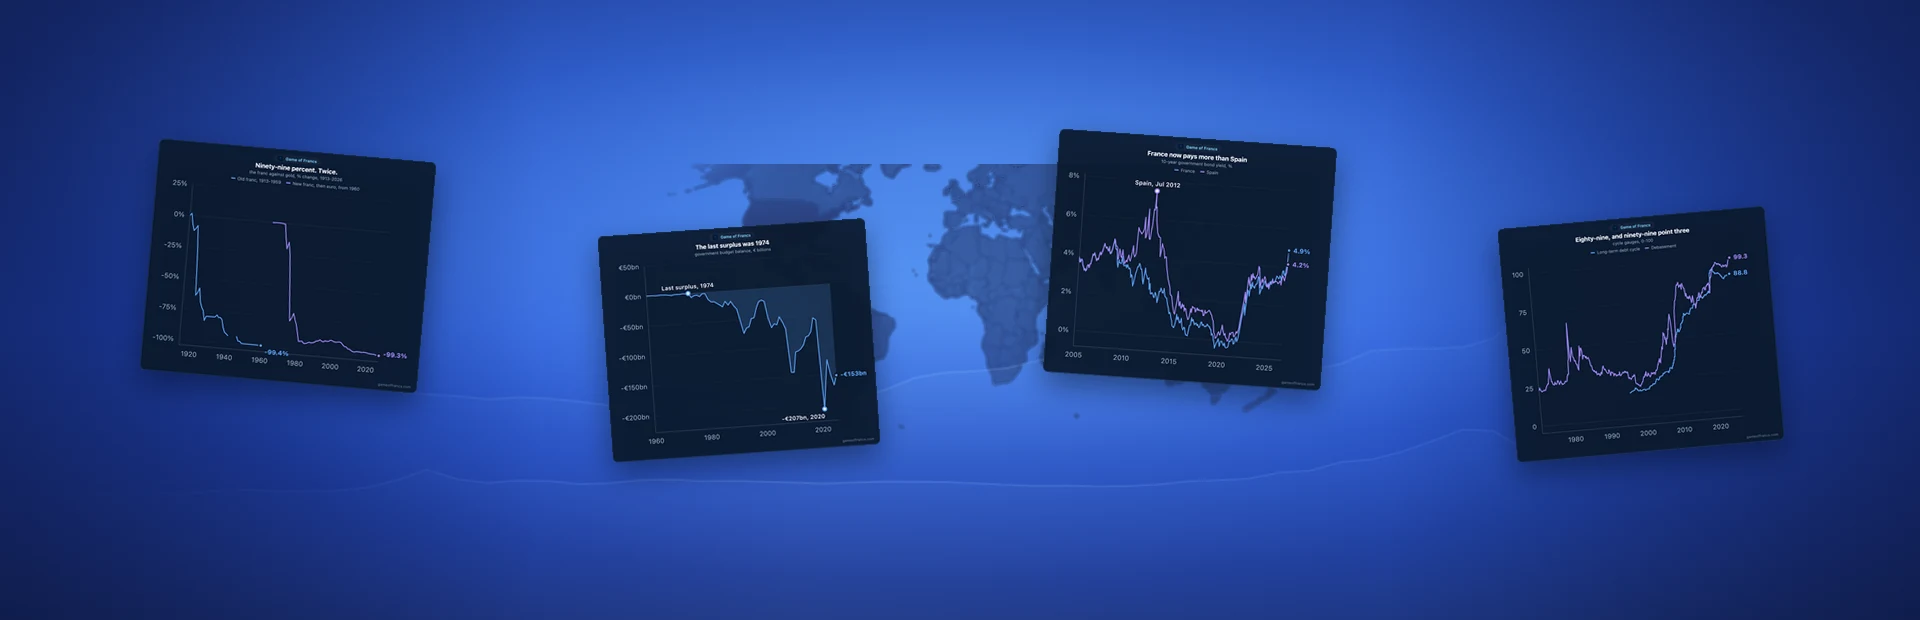
A portrait of France at reading length — a currency lost to gold twice, half a century of deficits, a state that spends 57% of what the country produces, the reactors it built, who owns it, and a government that now pays more to borrow than Spain.
by Game Of Francs Research Team
I. The Franc, Twice
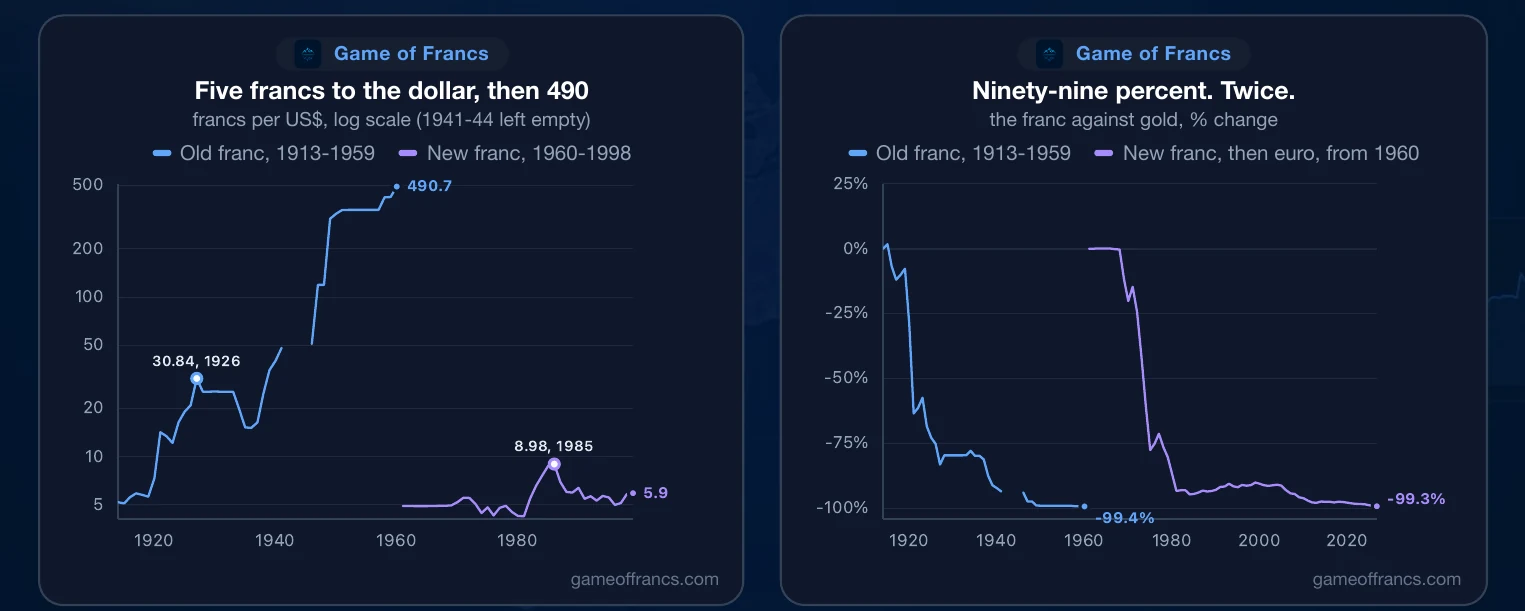
In 1913 a dollar cost 5.18 francs. The First World War broke that. By 1926 a dollar cost 30.84 francs, and in 1928 Raymond Poincaré fixed the franc at 25.50 to the dollar: a fifth of its pre-war value, fixed in law. Then came the next war. By 1959 a dollar cost 490 francs. The line is left empty from 1941 to 1944, the occupation years.
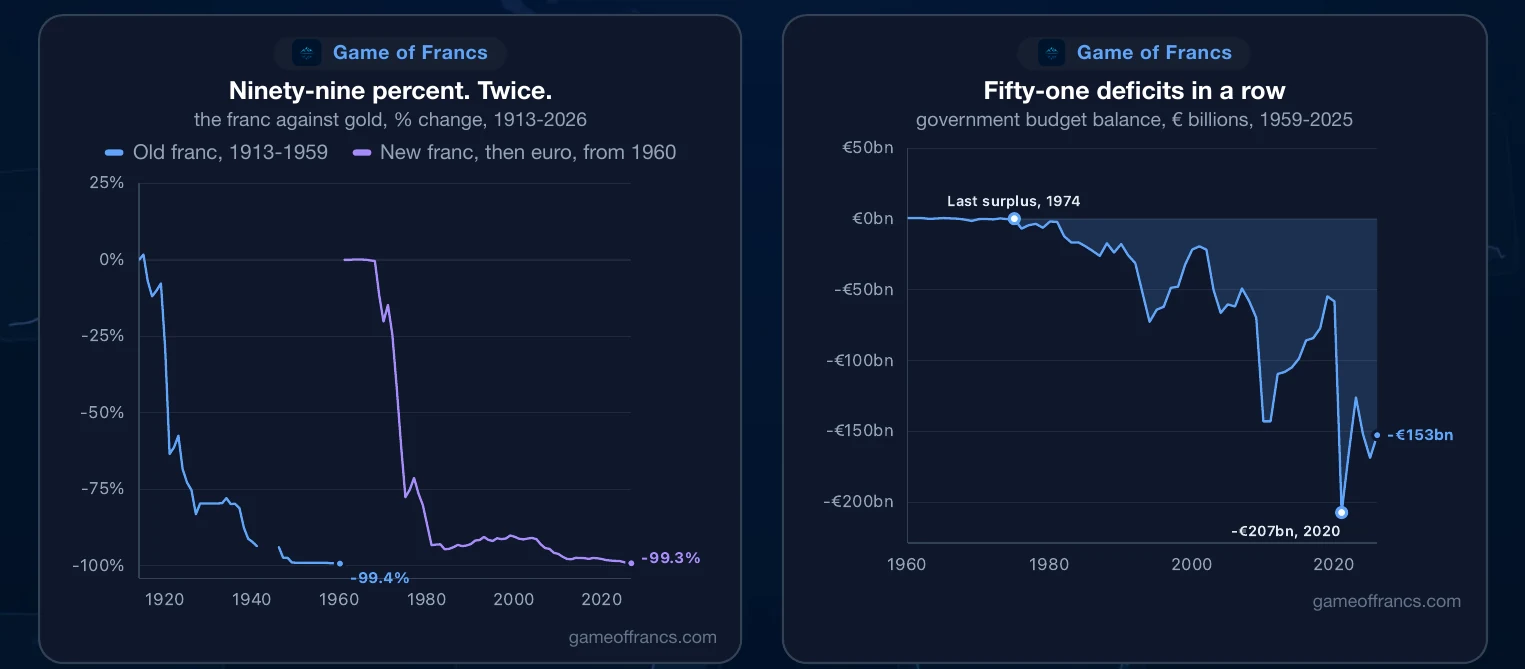
Measured in gold, the franc lost 99.4% of its value between 1913 and 1959. So in 1960 France struck two zeros off and started again. The new franc: 4.90 to the dollar.
It happened again. The dollar climbed to 8.98 new francs by the end of 1985. In 1999 the franc became the euro. And measured in gold, the new franc and the euro that replaced it have lost 99.3% since 1960. Two currencies, two lines, and the same destination.
II. Gold and the Price of Money
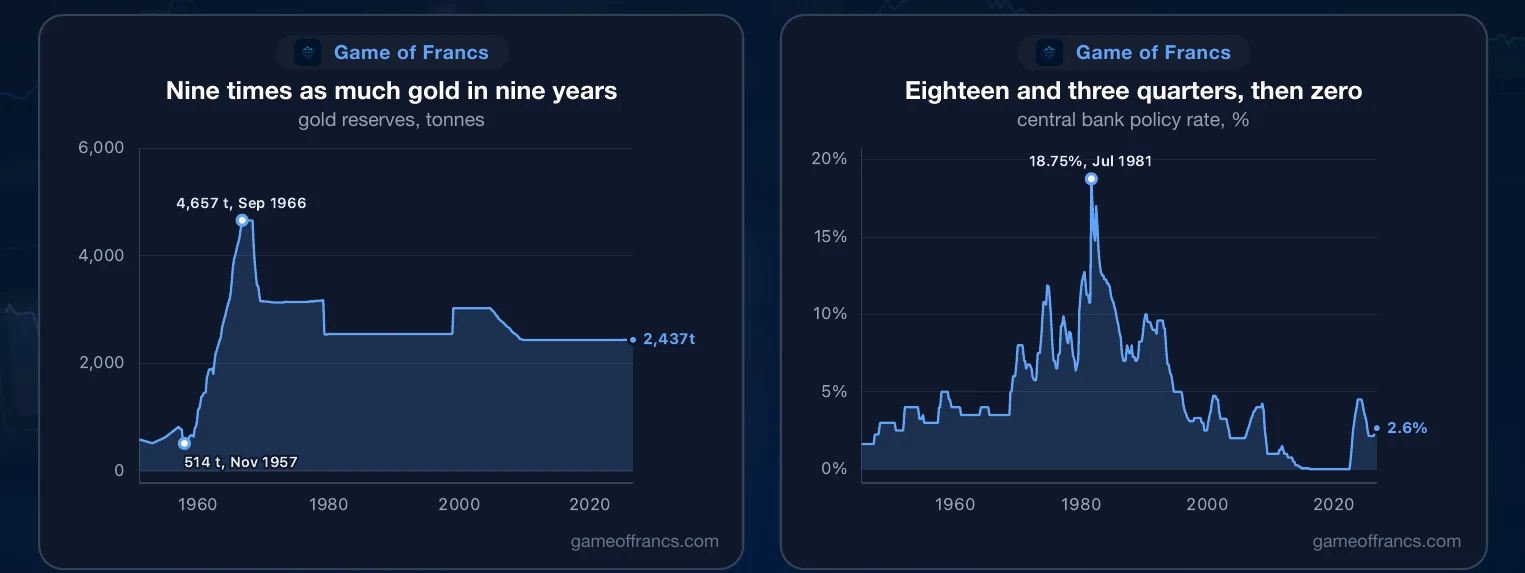
France did try to hold on to the metal. Its gold reserves were 514 tonnes in November 1957. Under de Gaulle, who asked for gold in exchange for the dollars France earned, they reached 4,657 tonnes in September 1966: nine times as much in nine years. France still holds 2,437 tonnes.
Interest rates draw the same line as the currency. The central bank's rate was 1.625% in January 1945. It reached 18.75% in July 1981. From March 2016 to July 2022 it was zero. It is 2.65% today, and it is set in Frankfurt now, not Paris.
What the state actually pays on its debt averaged 10.1% in 1983 and bottomed at 1.4% in 2021. It is 2.2% now. But on 1 October 2026 the ten-year rate reached 4.90%, above its July 2008 peak of 4.86%, and more than twice what France pays on what it already owes.
III. The People
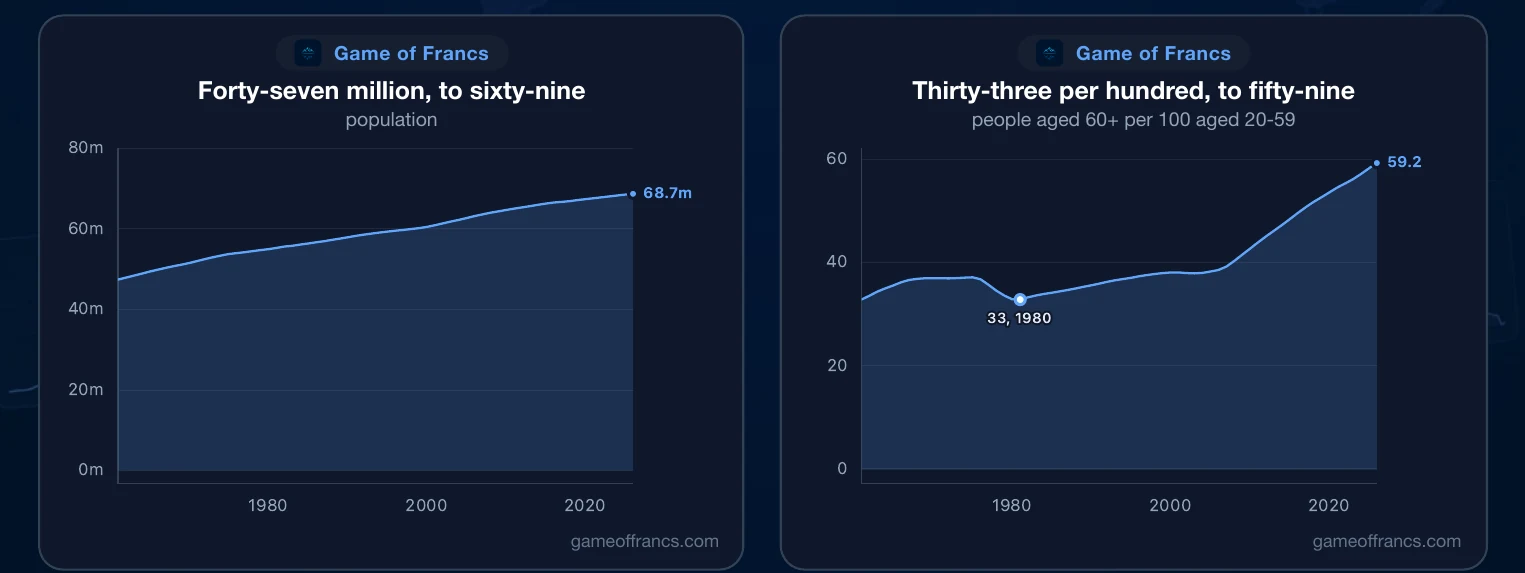
France had 47.4 million people in 1960 and has 68.7 million now. They live longer than their neighbours: life expectancy rose from 69.9 years to 83.0, which is 1.6 years more than Britain.
But fewer are being born. The birth rate was 13.3 per thousand in 2000 and is 9.7 now. There are 3.4 million children under five, fewer than in any year since 1960; in 1967 there were 4.35 million. In 1980 there were 33 people over sixty for every hundred aged twenty to fifty-nine. Today there are 59.
 FrancePopulation
IV. What France Produces
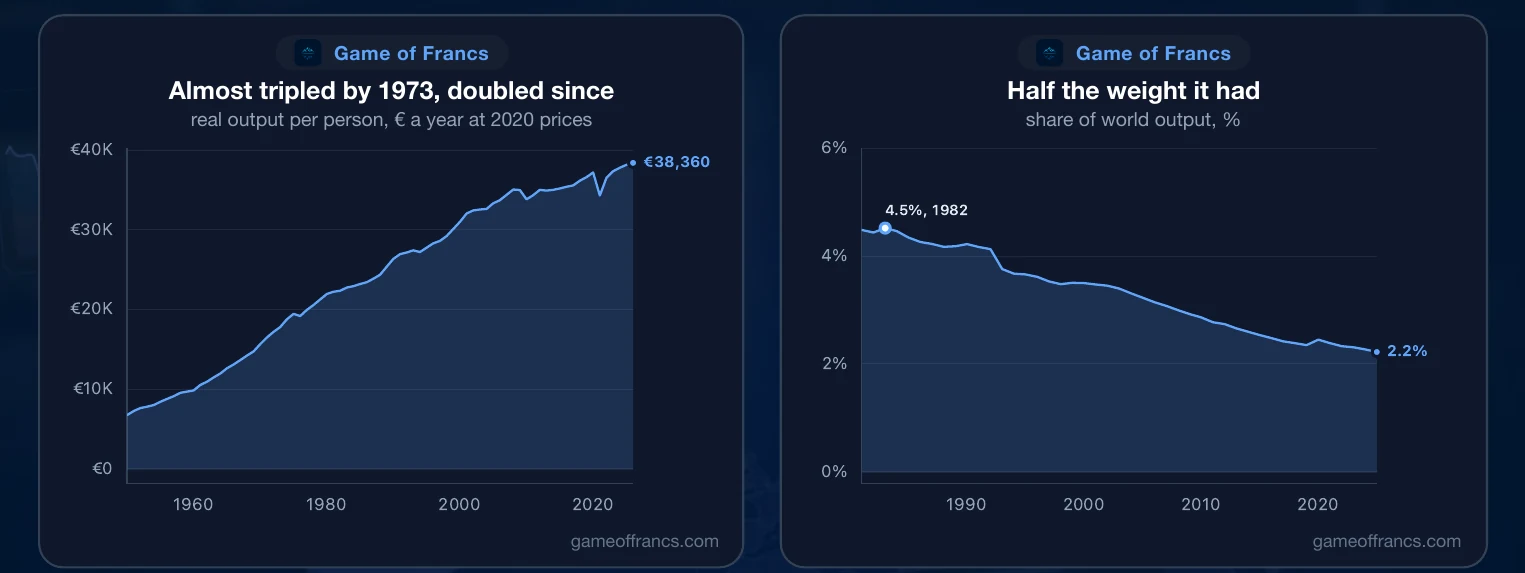
Output per person almost tripled between 1949 and 1973, from €6,742 a year to €18,738 at 2020 prices: the thirty glorious years. In the half-century since it has only doubled, to €38,360, and since 2000 it has grown by a fifth.
So France still grows. What has shrunk is its weight. France produced 4.5% of the world's output in 1982. It produces 2.2% now. Per head, at local prices, it ranks 27th of 180 countries: just behind Britain, well behind Germany.
V. Prices and Work
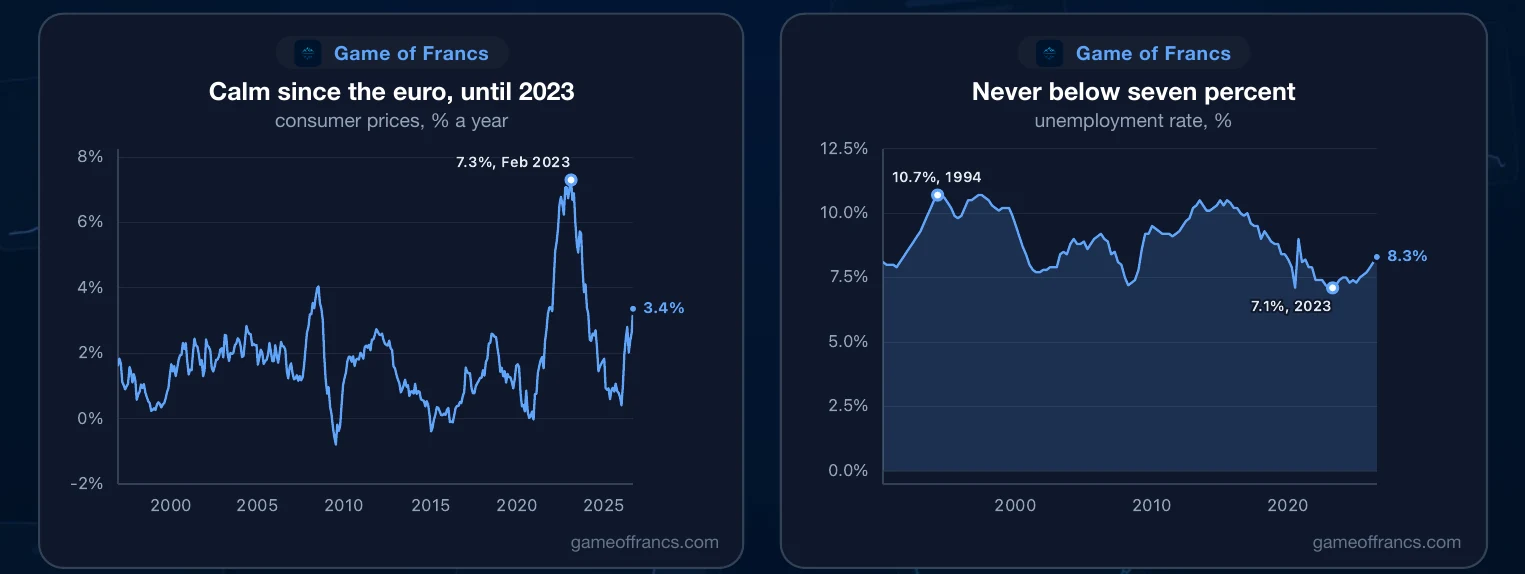
Prices have been the calm part since the euro. Inflation averaged 1.4% from 1997 to 2020, peaked at 7.3% in February 2023, and fell back to 2% by mid-2026. It was 3.4% in September 2026, the highest since early 2024. Work has not been. Unemployment has not dropped below 7% in any quarter since 1990. It peaked at 10.7% in early 1994 and got down to 7.1% in 2023. It has risen for six quarters in a row since, and at 8.3% it is the highest since 2020.
VI. The Factories
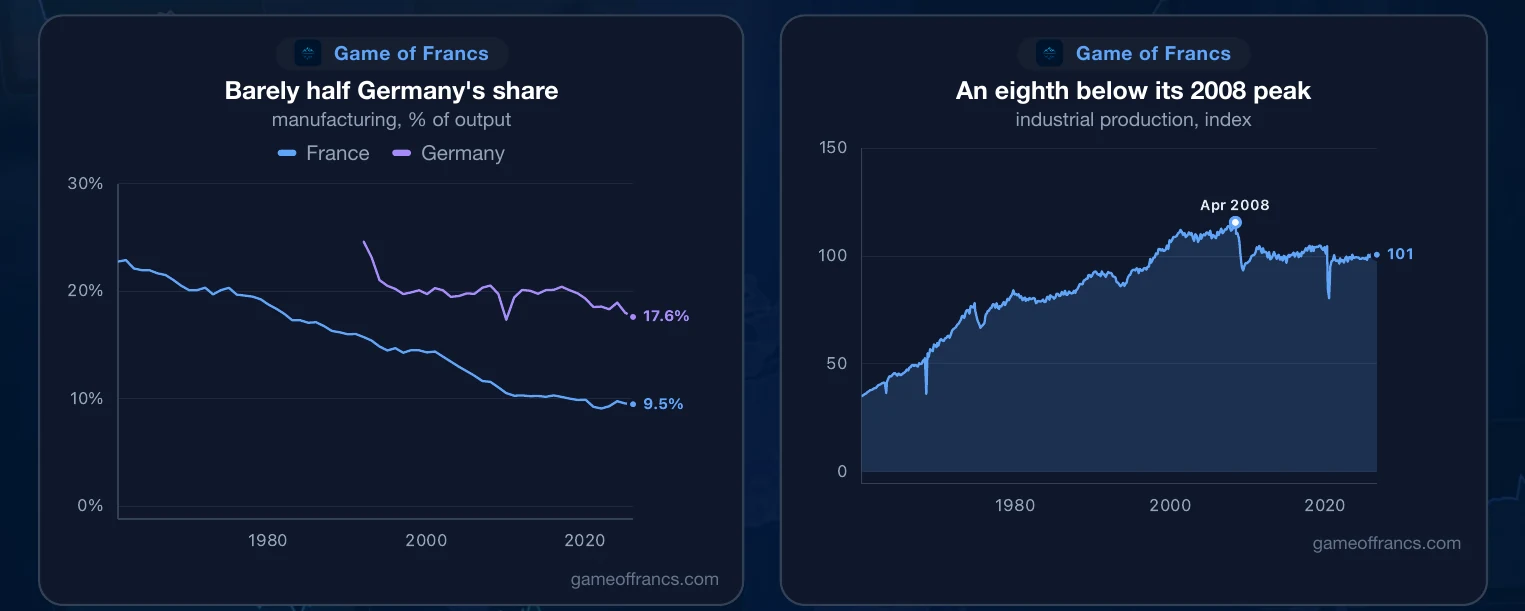
What France makes has changed more. Manufacturing was 23% of the economy in 1960. It is 9.5% now, barely half Germany's 17.6%.
Industrial production peaked in April 2008. It is an eighth lower today, back where it stood in late 1997: France makes less than it did eighteen years ago, in an economy that has gone on growing.
VII. Reactors and Carbon
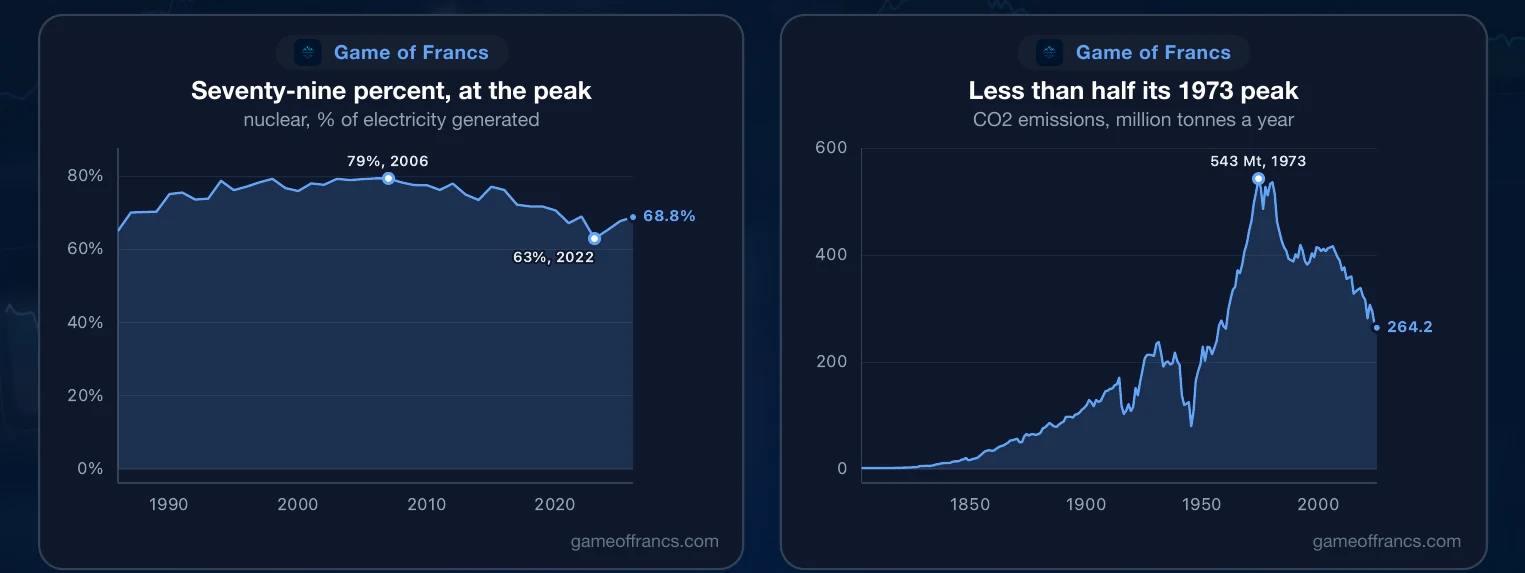
What France did build was reactors. It had one in 1959, and 59 by 2002. In 2006 nuclear made 79% of French electricity. In 2022, with reactors shut for repairs, the share fell to 63% and nuclear output to its lowest since 1988. It is back to 69%.
That is why French carbon has been falling since the 1970s. Emissions peaked in 1973 at 543 million tonnes. They are 264 million now, less than half. Per person, a French resident emits 4 tonnes a year: what one emitted in 1912, and well below a German's 6.8.
VIII. The State
In 1913 taxes took 8.6% of French national income, and there was no income tax at all. By 1924 the top rate was 72%. The tax share climbed for most of a century and peaked at 50.1% in 1999.
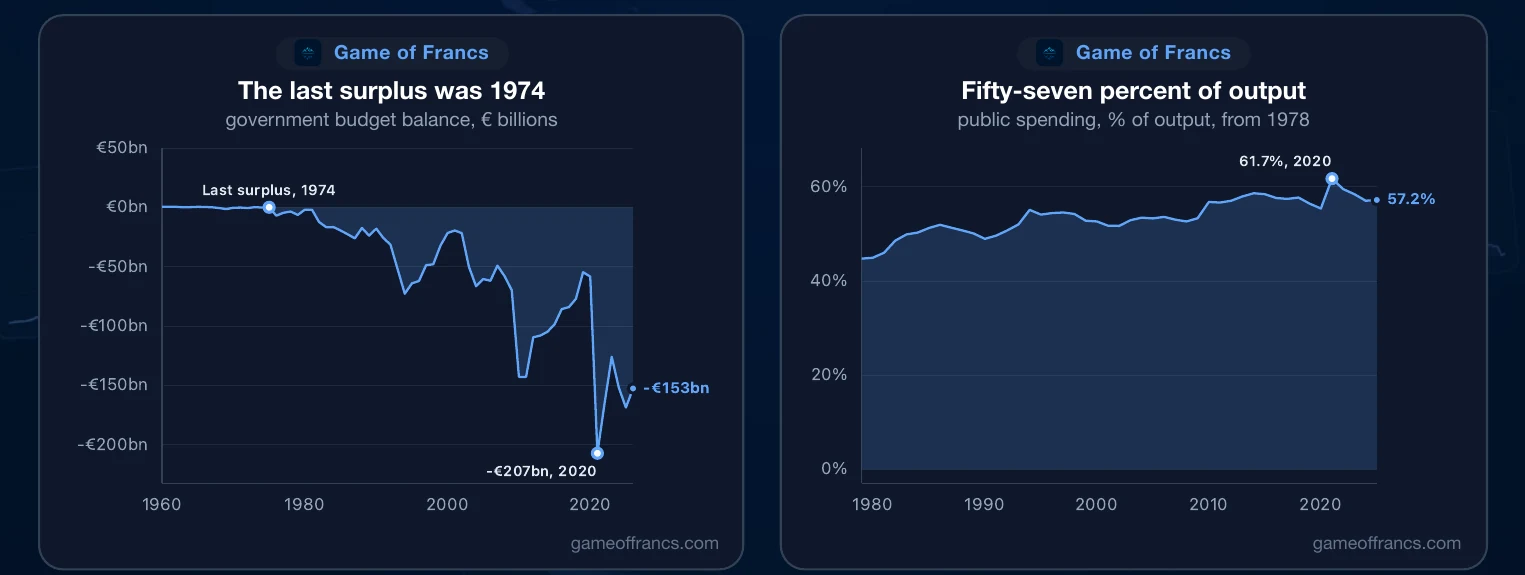
Spending went further. French public spending equals 57% of output. Of 151 countries, only five spend a larger share: three small island states, Ukraine at war, and Finland, by half a point.
And it has not paid for itself in half a century. In 1974 the French state ran a small surplus. It has run a deficit every year since: 51 in a row. Last year's was €153 billion, 5.1% of output. The largest, in 2020, was €207 billion.
IX. The Debt, and Spain
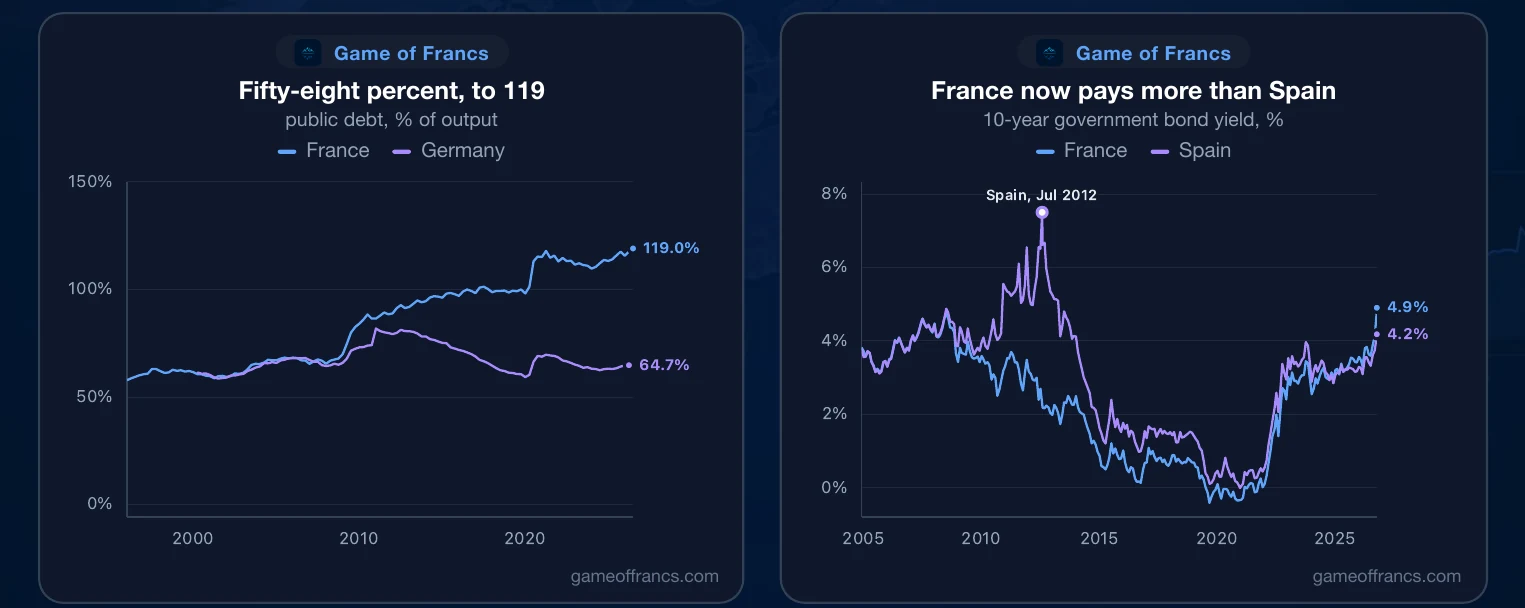
So the debt piled up. Public debt was 58% of output at the end of 1995. It was 119% at the end of June 2026, and it is still moving up: that is the highest in the three decades this measure covers, above the 117.8% of early 2021. Germany's is 65%. Count households and companies as well and France owes 332% of its output. Italy owes 233%, Spain 221%, Germany 200%.
Households are the smaller part of it. Their debt was 18% of output in 1977, peaked at 68% in 2020, and is 59% now, against 73% in Britain. House prices fell 4.8% in the year to March 2024, the steepest fall since 2009.
The market has noticed the state. In July 2012, at the height of the euro crisis, Spain paid 7.4% to borrow for ten years, and France 2.1%. On 1 October 2026 France paid 4.9% and Spain 4.2%. France has paid more than Spain on every trading day since June 2025.
X. Who Owns France
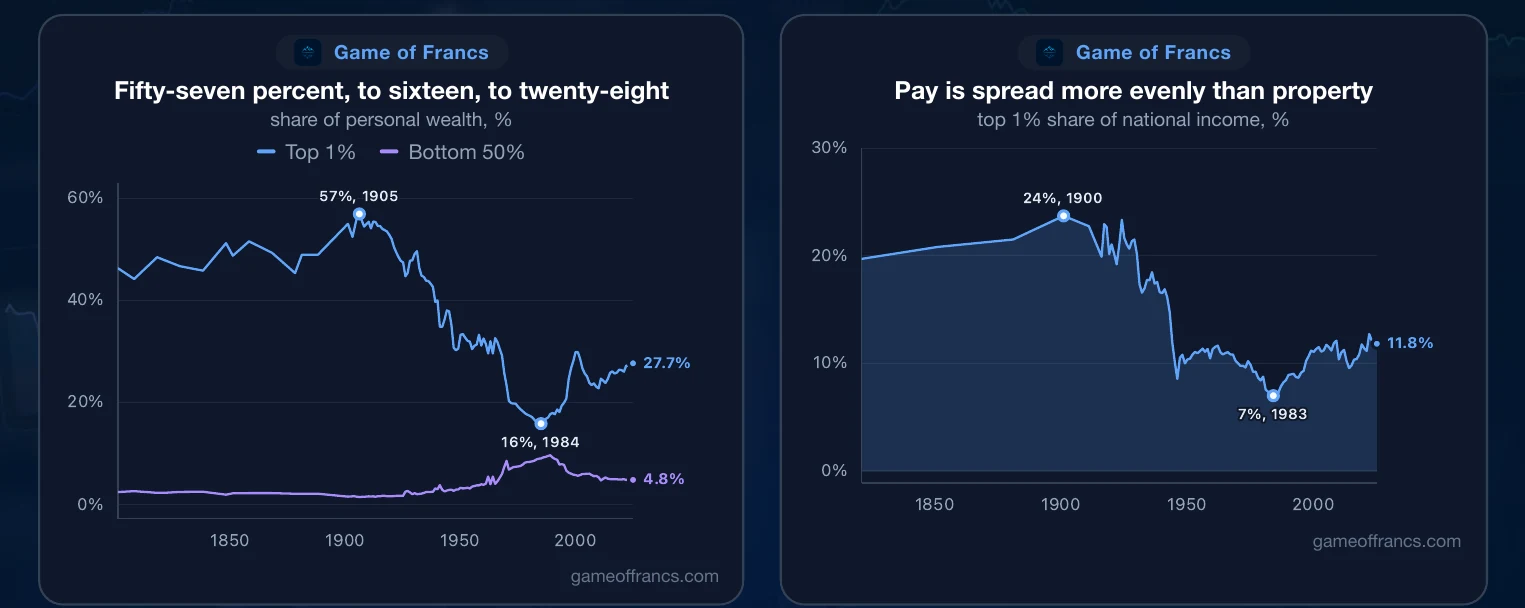
Wealth is where France is least like its reputation. In 1905 the richest 1% owned 57% of everything. Two wars, inflation and taxation brought that down to 16% in 1984. It is 28% now: higher than Britain's 21%, level with Germany. The poorer half of the country owned nearly 10% of the wealth in 1988. It owns under 5% now.
Income went the other way. The top 1% took 24% of all income in 1900, and 7% in 1983. They take 12% now: less than in Britain or Germany, where the figure is 13%, and not much more than half the American 21%. In France, pay is spread more evenly than next door. Property is not.
XI. The Stock Market
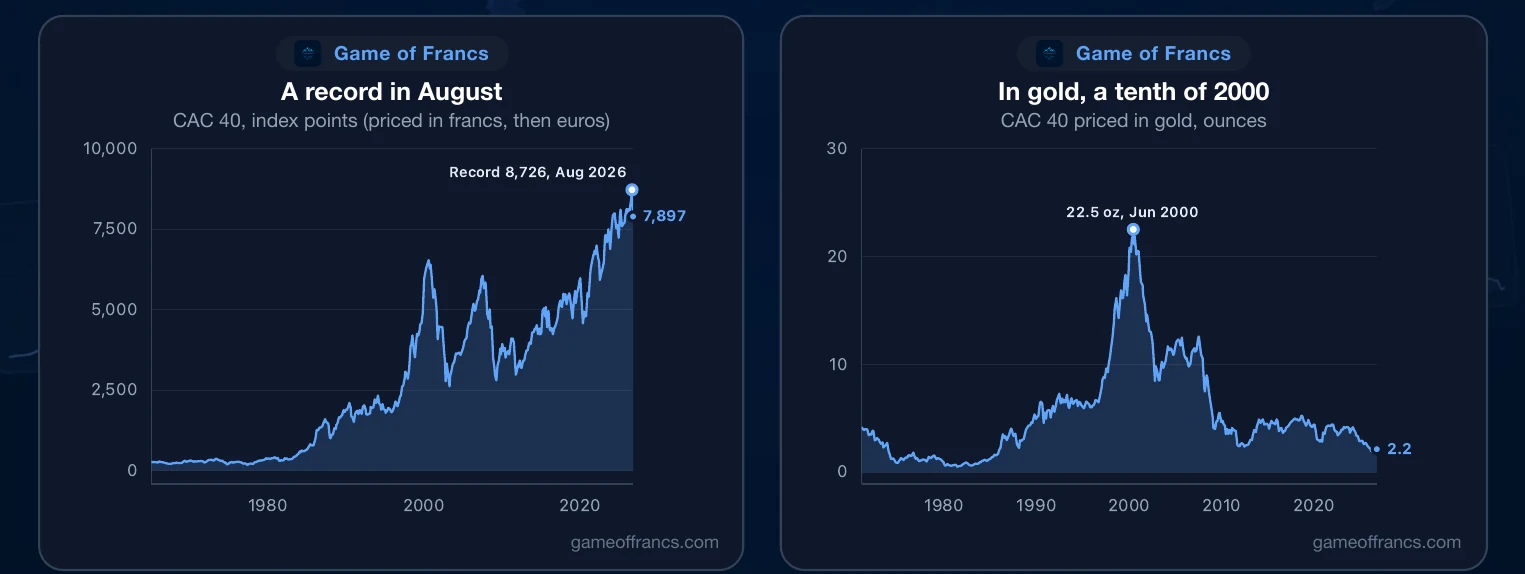
The Paris stock market set a record on 10 August 2026, with the CAC 40 at 8,726 index points. It ended September at 7,965.
Priced in gold it is a different chart. The index was worth 22.5 ounces of gold in June 2000 and is worth 2.2 ounces now: less than a tenth. The record is a record in euros, and the first section of this portrait is what happened to those.
XII. France and the World
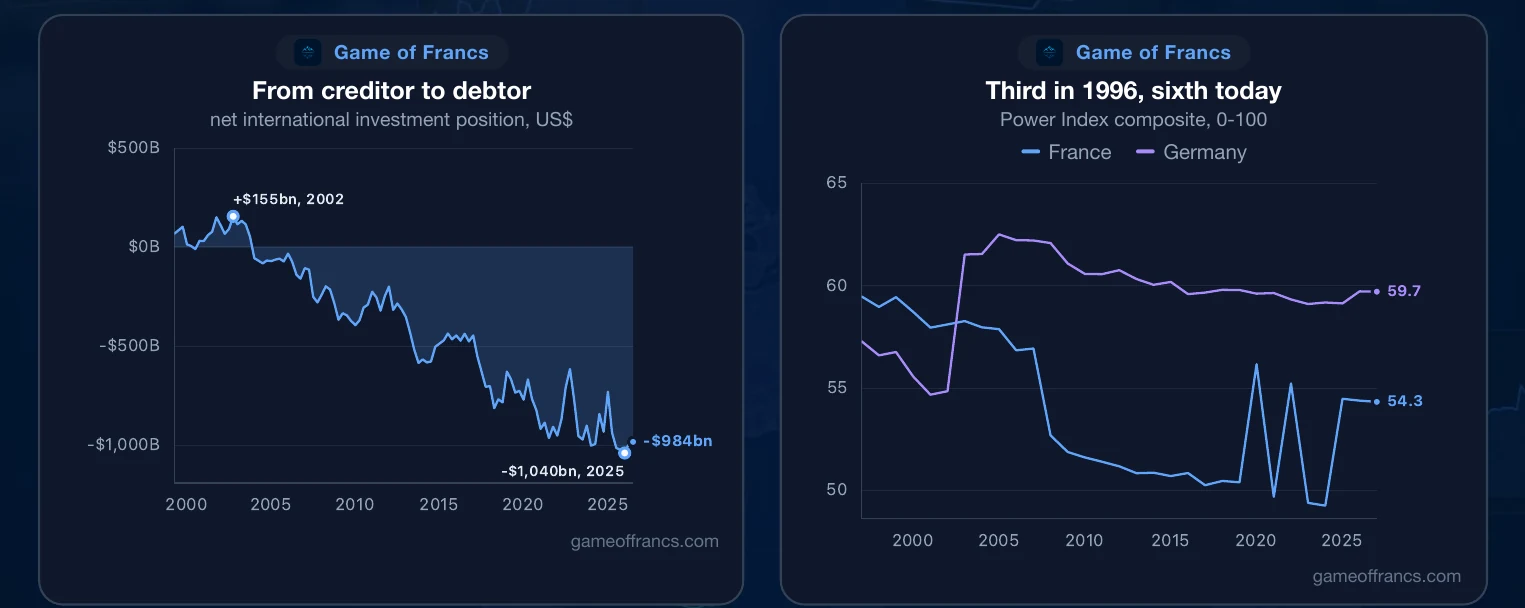
The balance sheet with the rest of the world has turned. In 2002 France owned US$155 billion more abroad than foreigners owned in France. At the end of 2025 it owed US$1,040 billion, the most it ever has. It owes US$984 billion now.
Our Power Index scores output, trade, military strength, innovation, reserve-currency status and governance together. It ranked France 3rd in the world in 1996, one place ahead of Germany. It ranks it 6th today, behind the United States, China, Germany, Japan and Russia.
XIII. Where France Is Now
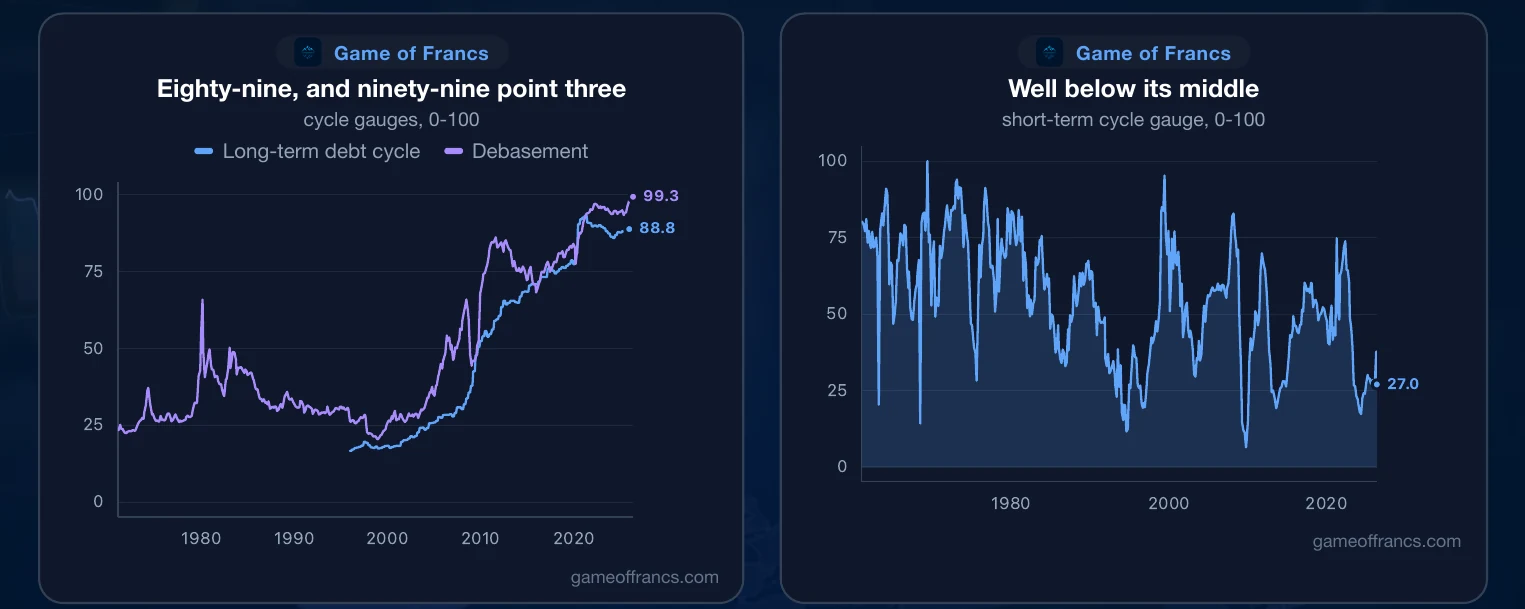
Four gauges place France against its own record, on a scale of 0 to 100 where 100 means never higher.
The long-term debt cycle reads 89. It has been above 80 every month since March 2020 and peaked at 93 in March 2021. In the thirty years this gauge covers, France has been more leveraged in only 42 months, every one of them since the pandemic.
Debasement, which is what money, credit and asset prices have done to the value of a euro, reads 99.3. It has been above 95 every month since September 2025.
The short-term cycle reads 27, well below its middle, where it has sat for most of the past year, and lower than the United States, Britain, Germany, Japan or China. Output grew a tenth of a percent last quarter, and unemployment is rising. Fiscal stimulus reads 71: the state is still pushing, though far less than in 2021.
Eighty-nine is very high, but France is not alone up there. The United States reads 92, Britain 87, Japan 86. Italy, with more public debt than France, reads 65 against its own record. Spain reads 48. Germany reads 26.
France lost its franc to gold twice. It built fifty-nine reactors and brought its carbon back to 1912. It has not balanced a budget since 1974, and the market now charges it more than Spain.
 FranceEconomic Cycle
The World in Charts
Get the next article by email
One email when a new piece is published. Nothing else, and one-click unsubscribe from any message.