
 China
ChinaChina in Charts
A complete portrait of China built entirely from our database — its people, how it got rich and who moved up, what it makes and sells, the energy it burns, the money and credit that financed it, the property slump and the state that stepped in, what it knows, who took the income, and where it stands now.
by Game Of Francs Research Team
I. The People
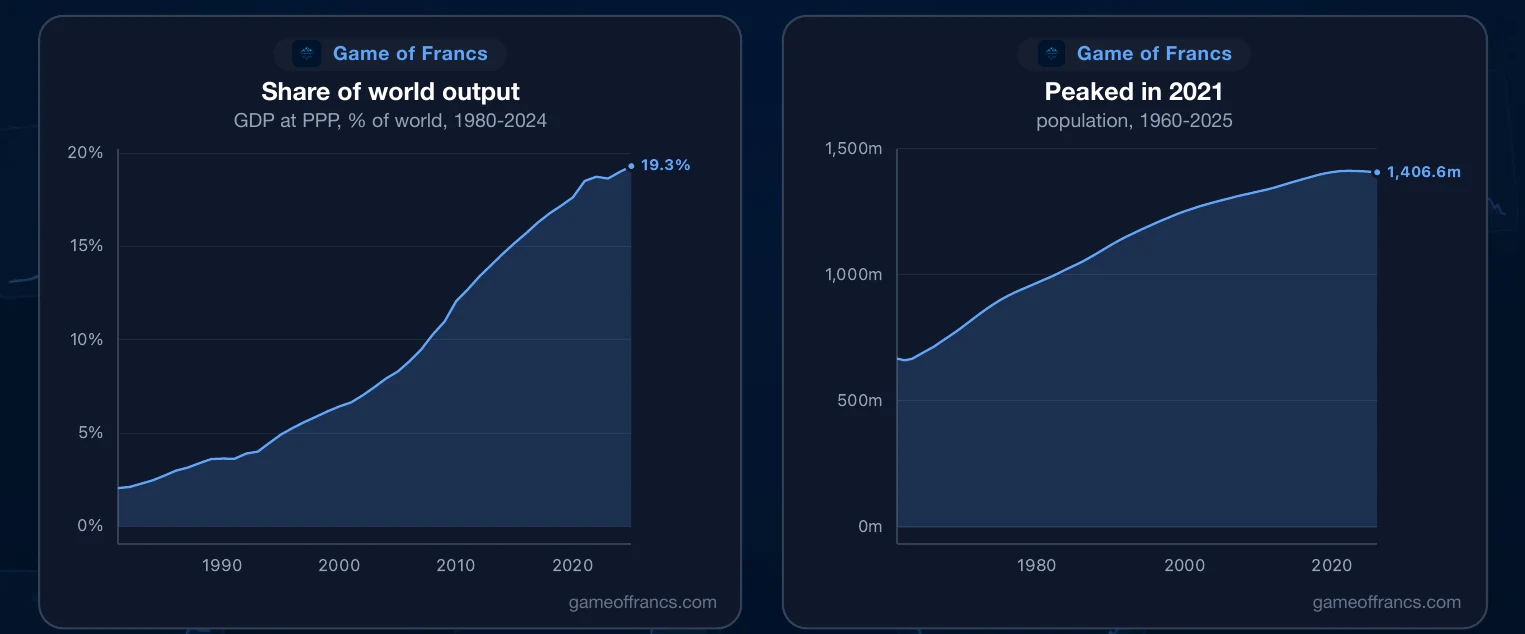
In 1980 China produced 2% of everything the world makes. By 2000 it was nearly 7%. Today it is more than 19%, the largest share of any country on earth. This portrait follows that rise and what it cost, and it starts with the people who made it.
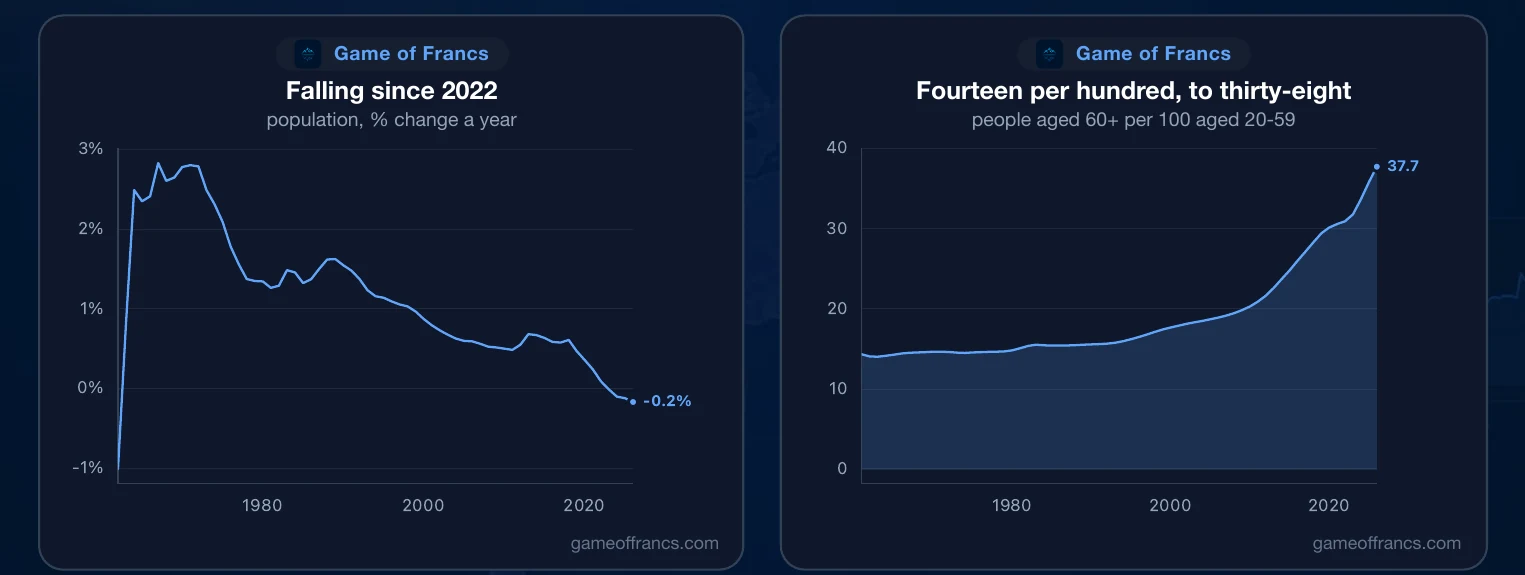
In 1960 China had 667 million people. The number more than doubled, and it peaked in 2021 at 1.412 billion. It has fallen every year since. A country that spent a generation limiting births is now watching them fall without any rule telling them to.
The country is ageing faster than it grew. In 1960 there were 14 people over sixty for every hundred aged twenty to fifty-nine. Today there are 38. Nearly 37 million Chinese are over eighty, sixteen times as many as in 1960.
II. Longer Lives, Fewer Births
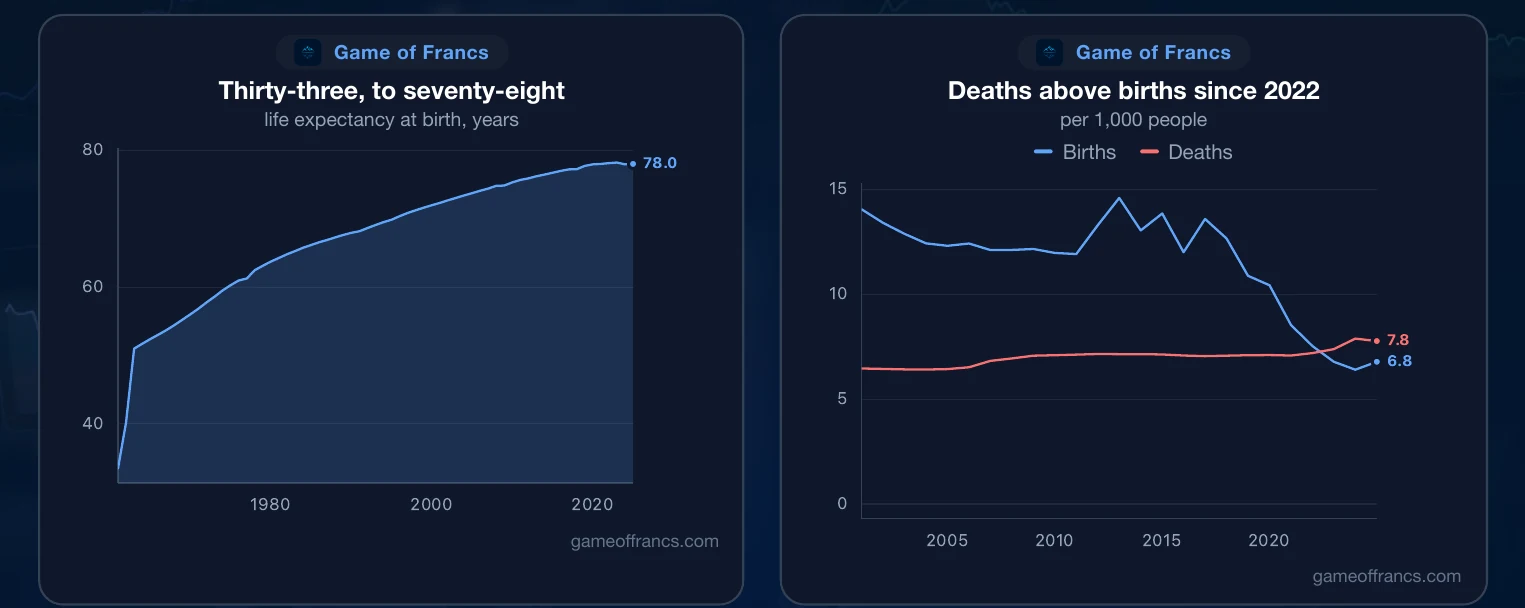
They also live far longer. In 1960, in the middle of a famine, life expectancy at birth was 33 years. It passed 72 by 2000 and is 78 today.
The other side of the ledger is births. In 2000 there were 14 births for every thousand people. By 2023 there were 6.4, the lowest in the record. In 2022 deaths outnumbered births for the first time in the modern record, and they have every year since.
Fewer children and longer lives mean fewer workers carrying more retirees. Everything that follows in this portrait, from saving to property to the state's debts, plays out against that curve.
III. How It Got Rich
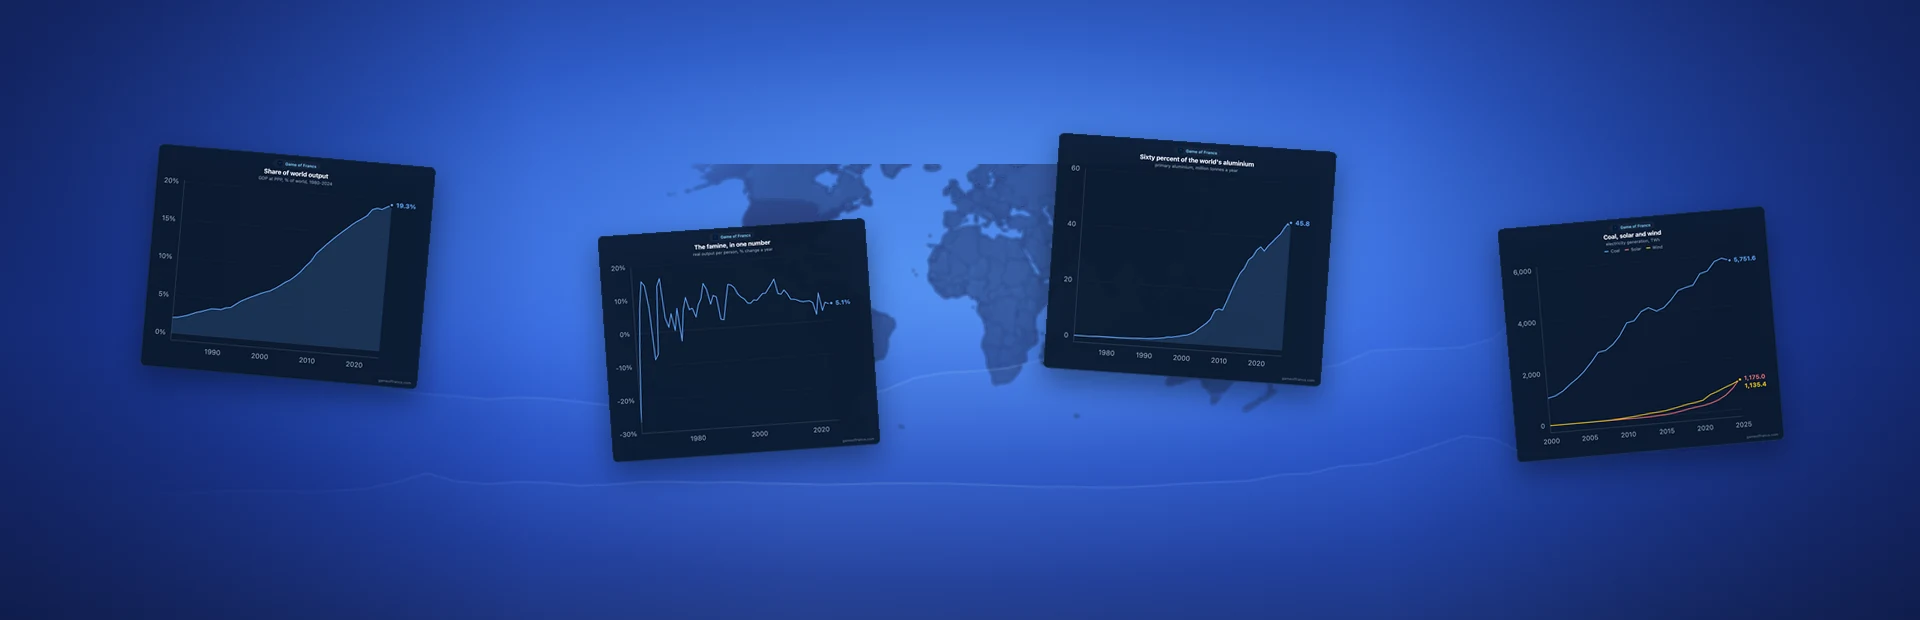
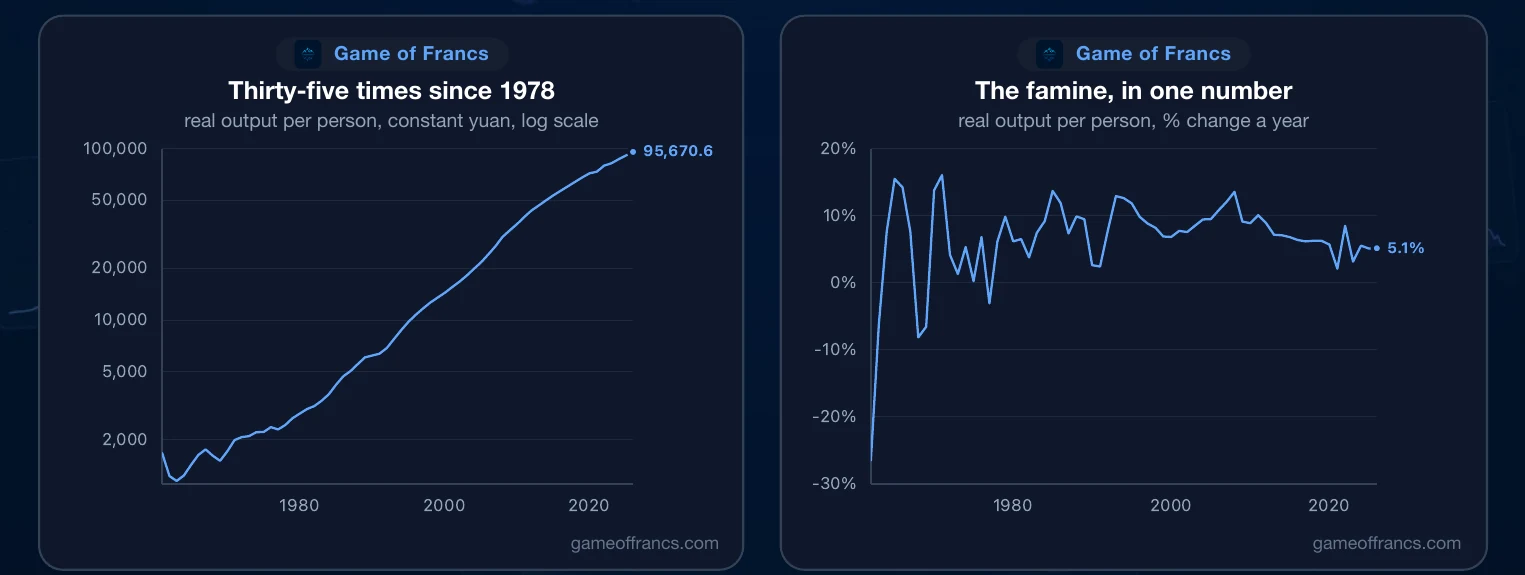
The famine is visible in every long series. In 1961 output per person collapsed by more than a quarter in a single year, the deepest fall in the record. The country that began its reforms in 1978 was still very poor: real output per person was only 60% higher than in 1960.
What followed transformed the country. Real output per person has multiplied thirty-five times since 1978, and it still grew 5.1% last year. That growth did not come from printing or spending. It came from capital: from a poor country saving an extraordinary share of what it produced and turning it into factories, machines, roads and ports.
IV. Who Moved Up
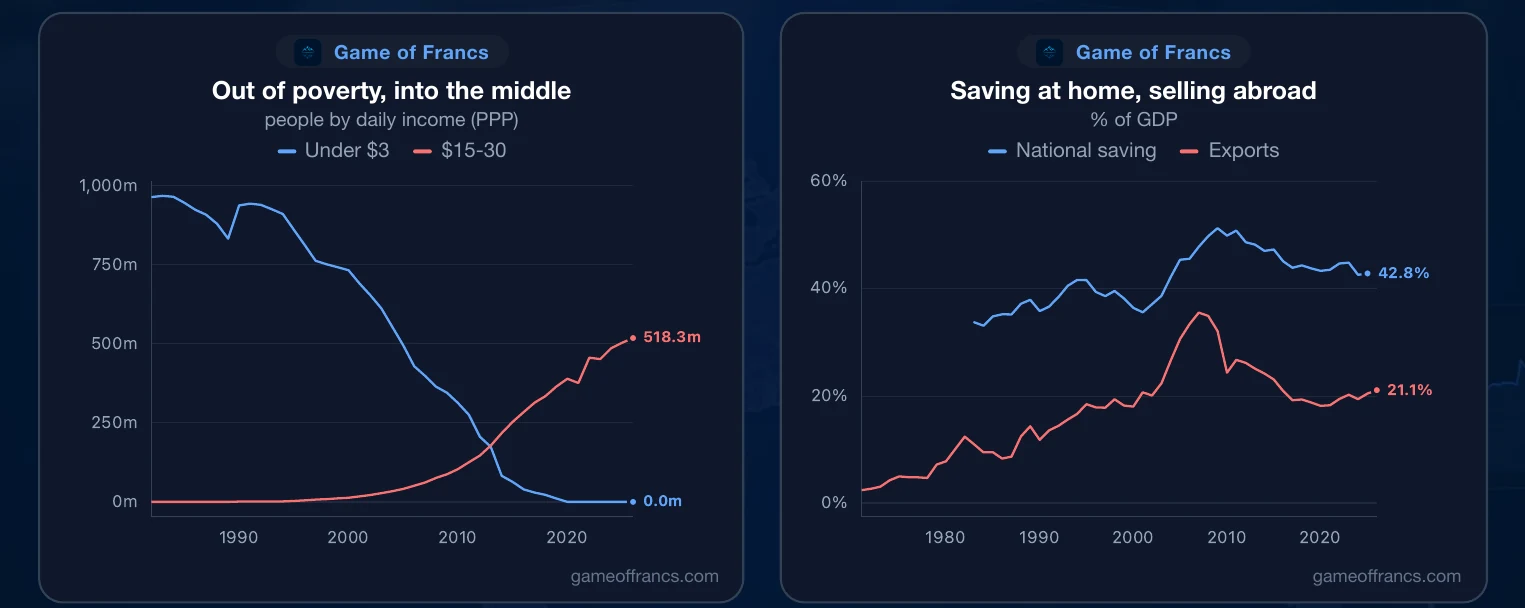
In 1981, 964 million Chinese lived on less than three dollars a day, 97% of the population. By 2019, measured the same way, none did.
Today more than half a billion Chinese live on fifteen to thirty dollars a day, and another 174 million on thirty to sixty. The engine was saving. At its peak in 2008 China saved 51% of everything it produced, and it still saves 43%. That capital went looking for markets abroad: exports rose from under 3% of output in 1970 to 35% in 2006, and are 21% today.
V. China and the United States
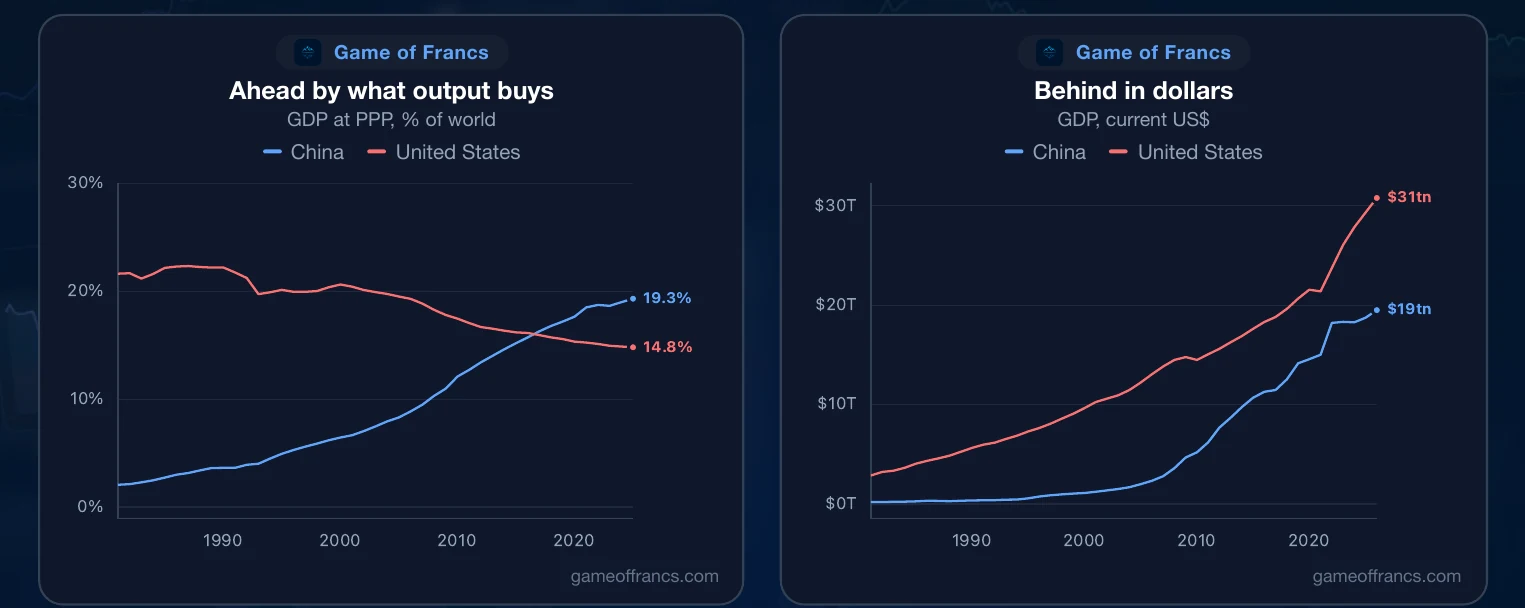
Measured by what its output can buy at home, China passed the United States in 2016 and is now 30% larger. Its share of world output rose from 2.1% in 1980 to 19.3%, while America's fell from 21.6% to 14.8%.
Measured in dollars, the picture is different. China's economy is $19.5 trillion against America's $30.8 trillion, 63% of the size. The gap has widened since 2021, when China reached 77%. Both statements are true at once: China's output buys far more at home than its dollar value suggests, and its currency and prices count for less abroad.
VI. From the Fields to Services
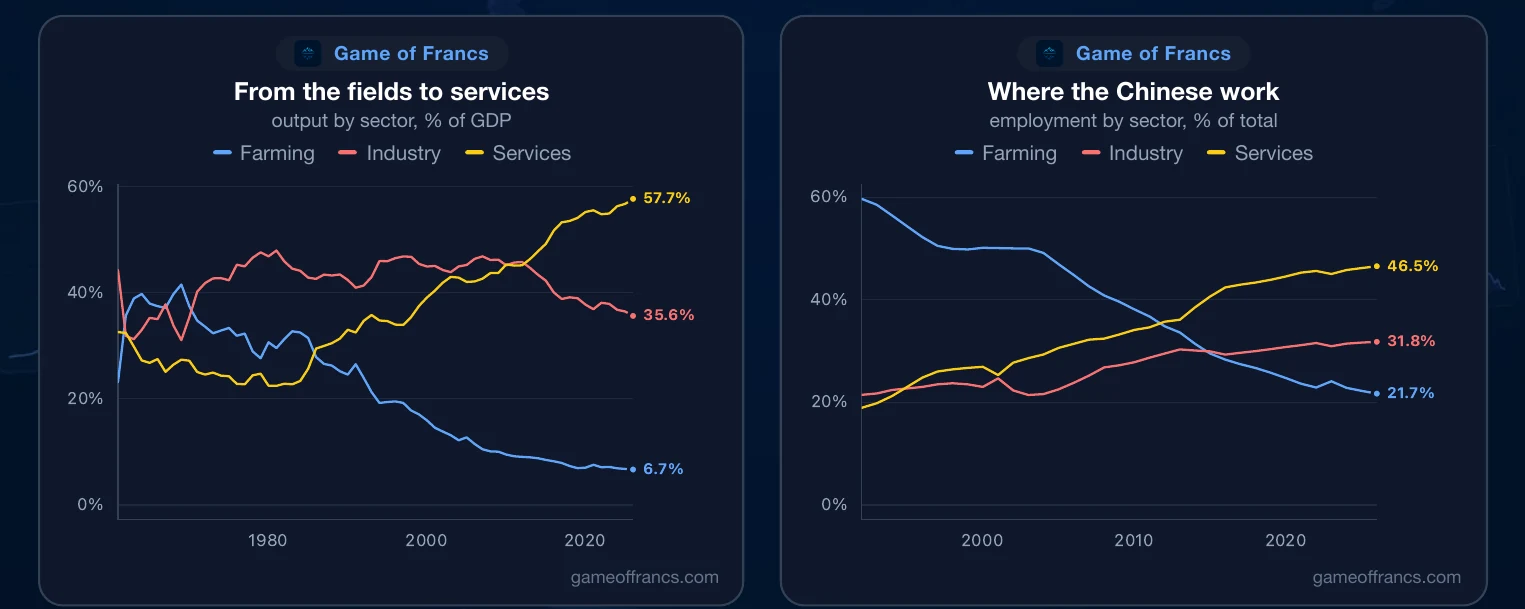
What does China make? In 1968 farming was 42% of the economy. It is under 7% now. Services grew from 22% in 1980 to 58%. Industry, which peaked at 48% in 1980, is 36%.
The workforce moved with it. In 1991, 60% of Chinese workers were in farming. Today it is 22%. Industry employs close to a third of the workforce, and services 47%. Fewer Chinese work at all: labour-force participation has fallen from 79% in 1990 to 65%.
VII. The Factories
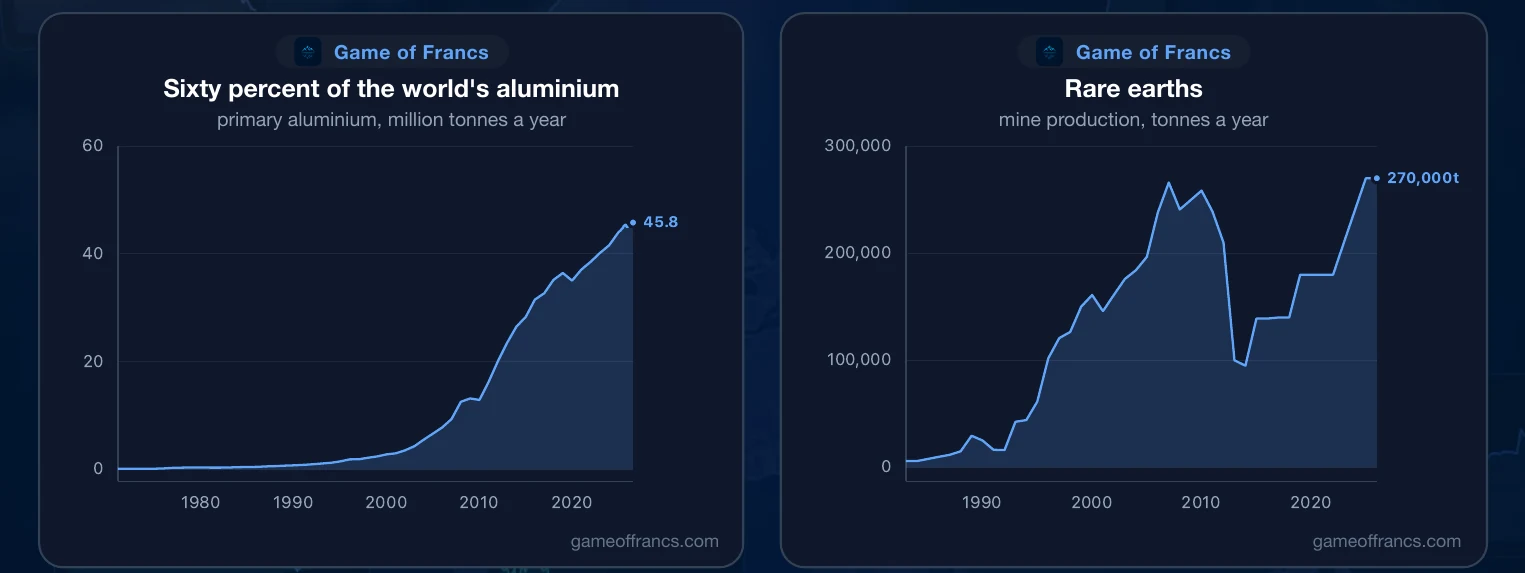
The factories are what the world sees. China made 127,000 tonnes of aluminium in 1970 and 3 million in 2000. It makes nearly 46 million tonnes a year now, 60% of the world's supply, against 13% in 2000.
It mines 270,000 tonnes of rare earths a year, up from 6,000 in 1982: the metals inside every motor, magnet and screen. In both cases the lead was built by the same method as everything else: capital poured, year after year, into capacity ahead of demand.
VIII. Trade and Reserves
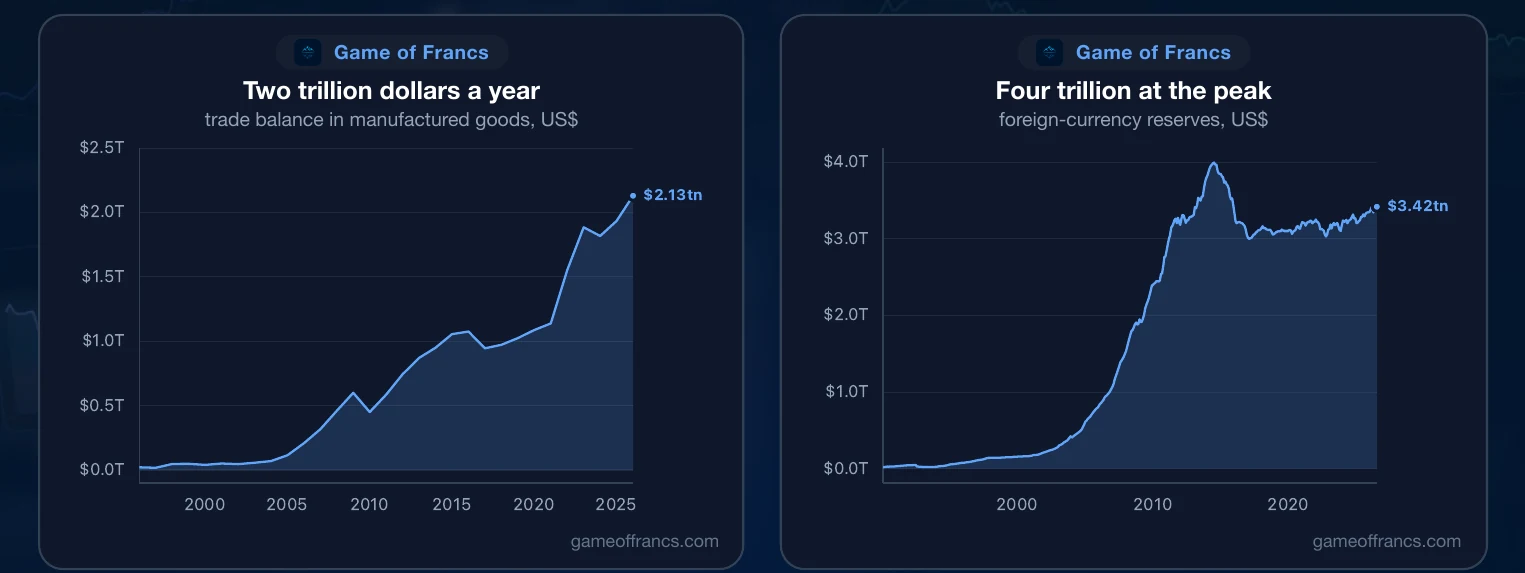
China's surplus in manufactured goods reached $2.1 trillion in 2025, its largest ever. Against it, China buys the raw materials it lacks: it runs a deficit of some $400 billion a year in fuels, and about as much in ores and metals.
The surpluses piled up abroad. Foreign-currency reserves peaked at $3.99 trillion in June 2014 and stand at $3.4 trillion. Counting everything the country owns abroad minus what it owes, net foreign assets have passed $4 trillion.
IX. Energy
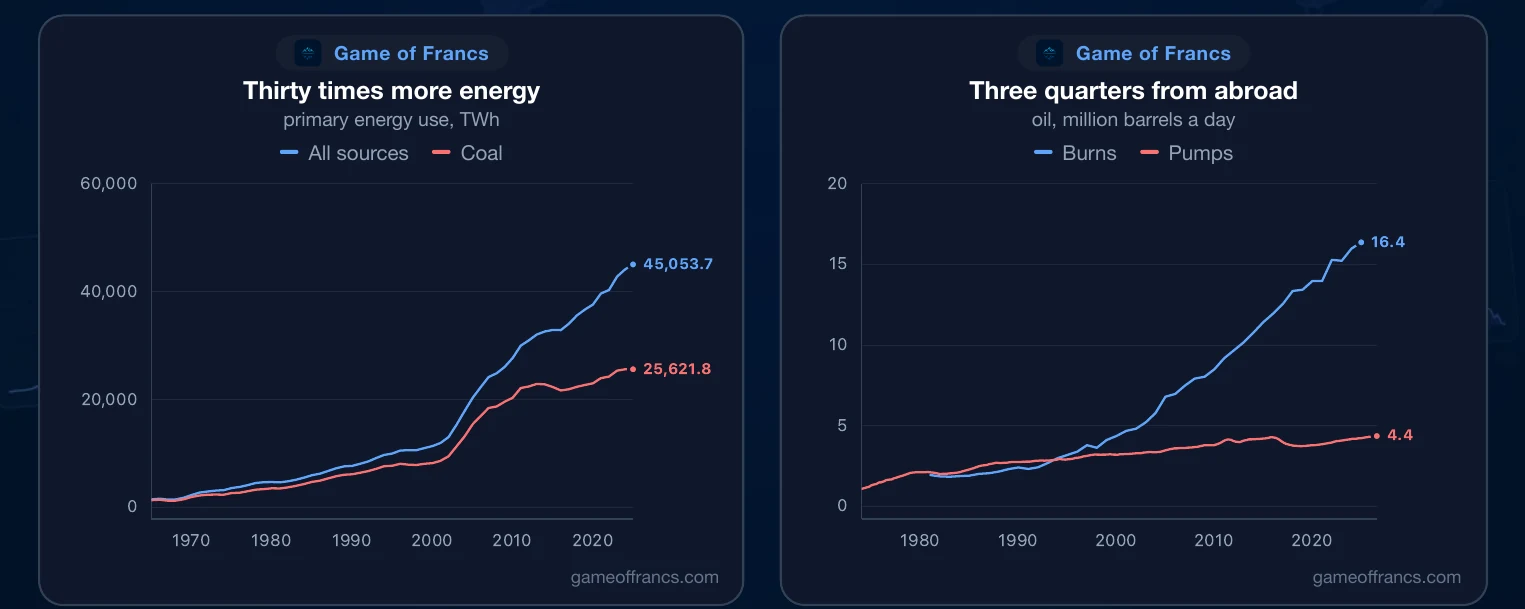
Powering all of this took energy on a scale the world had not seen. China's primary energy use has multiplied thirty times since 1965. Coal still supplies 57% of it, down from 80% in 1990.
Oil is the weak point. China pumps about 4.4 million barrels a day and burns more than 16 million, so nearly three quarters of its oil comes from abroad. A country with a $2 trillion surplus in manufactures still depends on sea lanes it does not control for most of its fuel.
X. Electricity
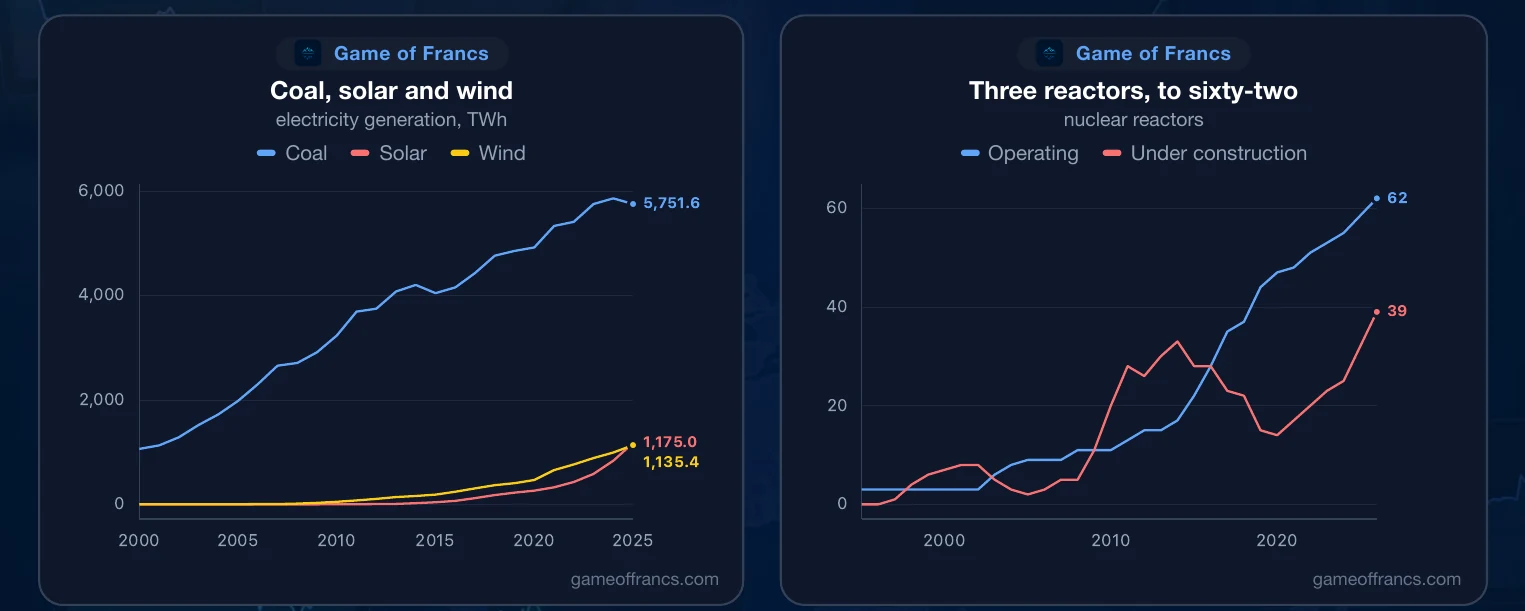
The fastest change is in electricity. Solar generated less than one terawatt-hour in 2010. In 2025 it generated 1,175, and wind 1,135. Coal generation peaked in 2024 at 5,860 terawatt-hours and fell in 2025.
China is also building the world's largest nuclear programme. It had three reactors in 2000. It has 62 now, with 39 more under construction, more than any other country.
XI. Money and Credit
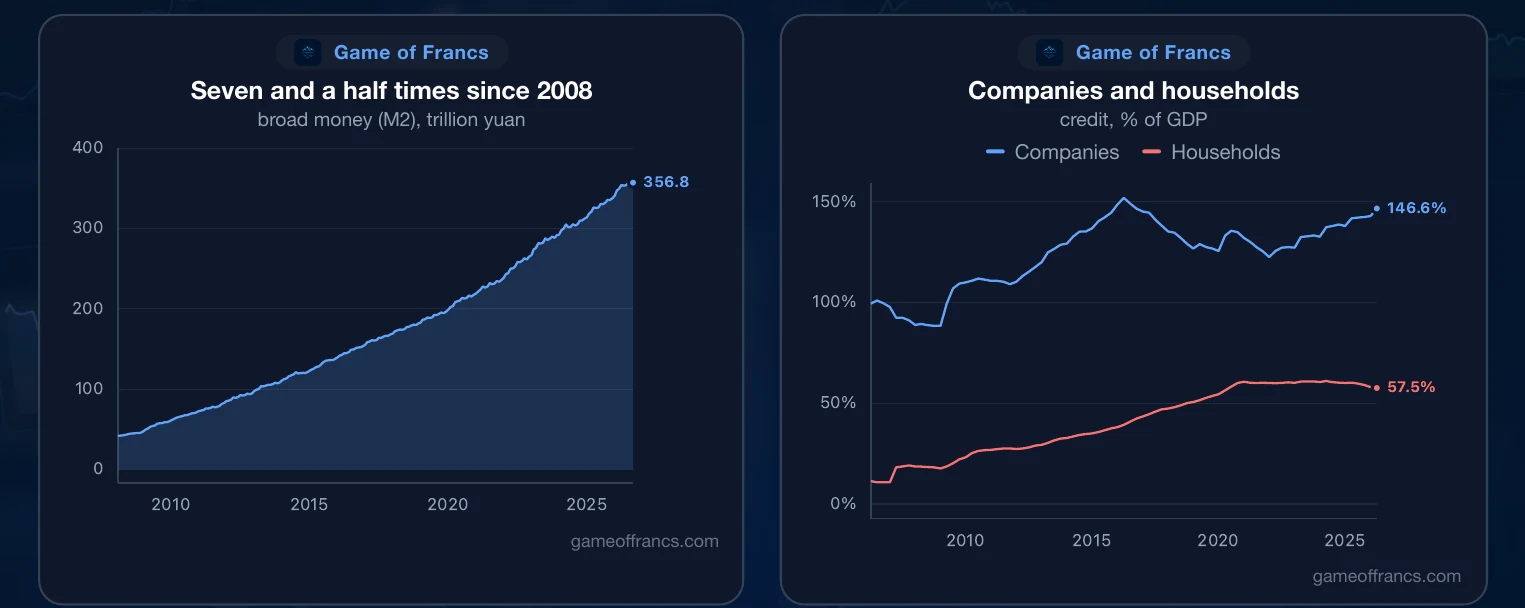
Money and credit tell the next part. China's broad money supply has grown seven and a half times since 2008, to 357 trillion yuan. Company debt peaked at 152% of output in 2016 and is 147% now, among the highest of any large economy. Household debt climbed from 11% in 2006 to a peak of 61% in 2024 and is 57% today.
The central bank's own balance sheet moved the other way, shrinking from 64% of output in 2008 to 35%. The credit that built modern China was created mostly by the banking system, not bought by the central bank.
When credit grows that much faster than output, it does not all go into productive capital. Some of it goes into projects that only make sense while credit stays cheap and plentiful. That is where the next sections go.
XII. Markets, the Yuan and Gold
China's stock markets are worth $15.5 trillion, second only to America's, and list 11,149 companies, against 323 in 1995.
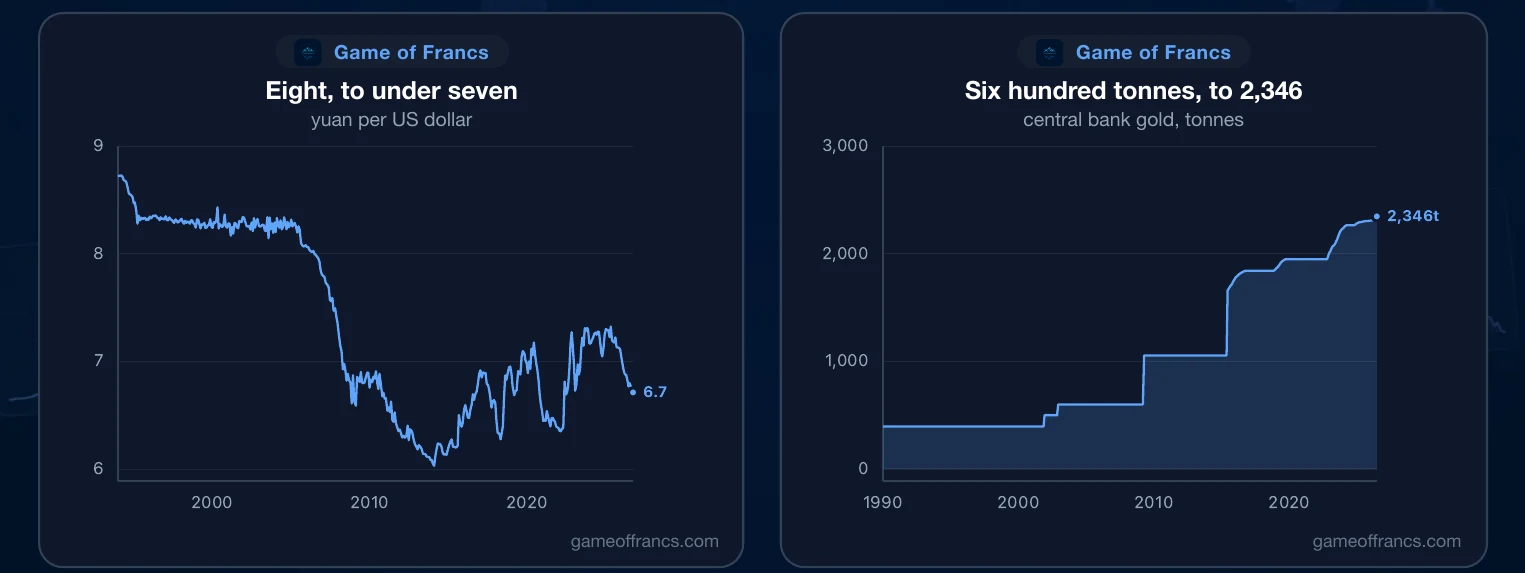
The yuan traded above eight to the dollar in 2000 and is near 6.7 today. The central bank holds 2,346 tonnes of gold, up from 600 in 2008, almost four times as much.
XIII. Property, Rates and Prices
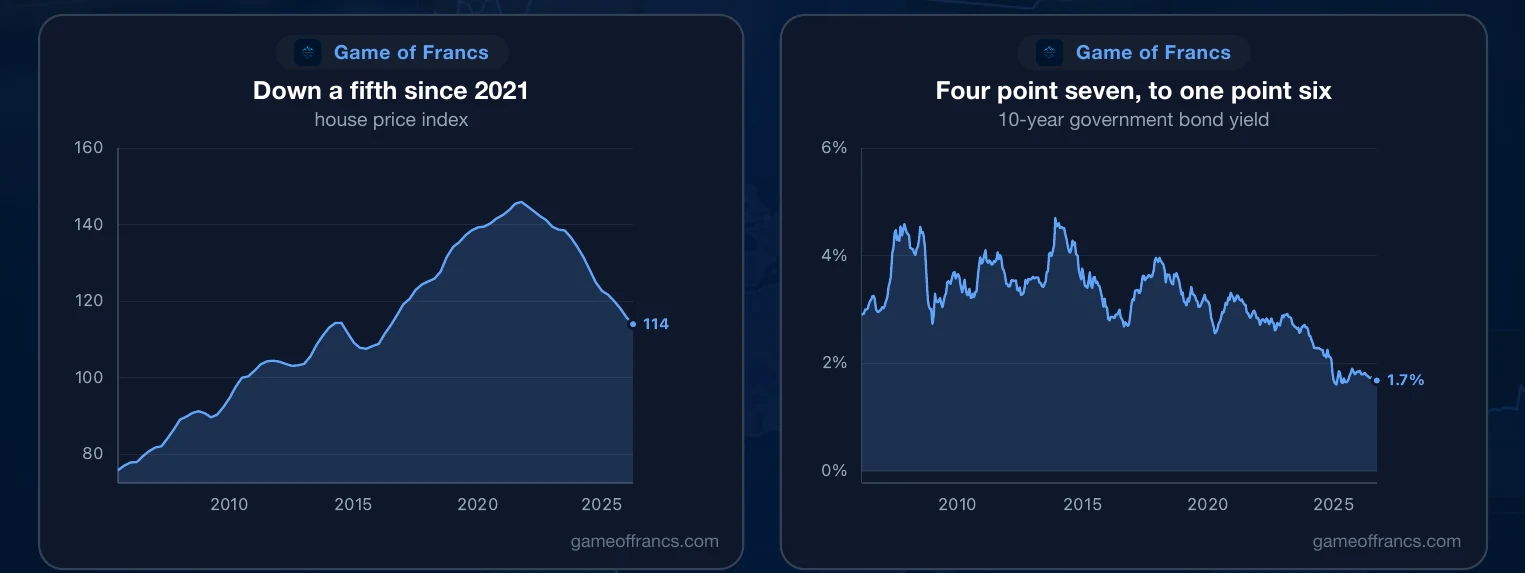
Much of the credit went into property. House prices peaked in September 2021 and have since fallen by more than a fifth.
The bond market reads the same slowdown. The ten-year government yield stood at 4.7% in November 2013. It fell to a record low of 1.6% in February 2025 and is 1.7% now. Factory-gate prices fell every month from October 2022 to February 2026, and consumer inflation has stayed close to zero. Only this year have producer prices turned up, to 3.7% in August.
XIV. The State
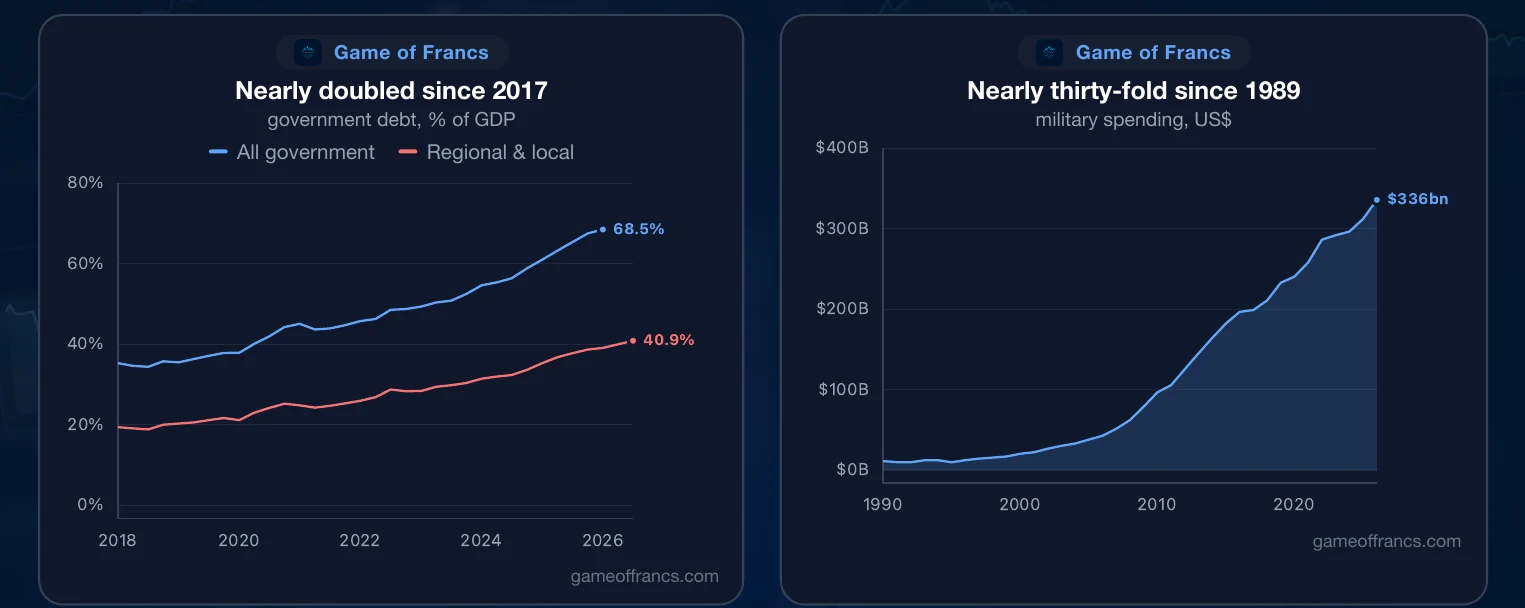
The state has stepped in. Government debt, counting the regional and local governments that financed much of the building, has nearly doubled since 2017, to 69% of output. The regional and local share alone went from 19% to 41%. The budget deficit runs near 5% of output.
Military spending has grown nearly thirty-fold since 1989, to $336 billion, while falling as a share of output from 2.4% to 1.7%. A state that can spend thirty times more while taking a smaller share of the economy is a measure of how fast the economy grew under it.
XV. Knowledge and the Air
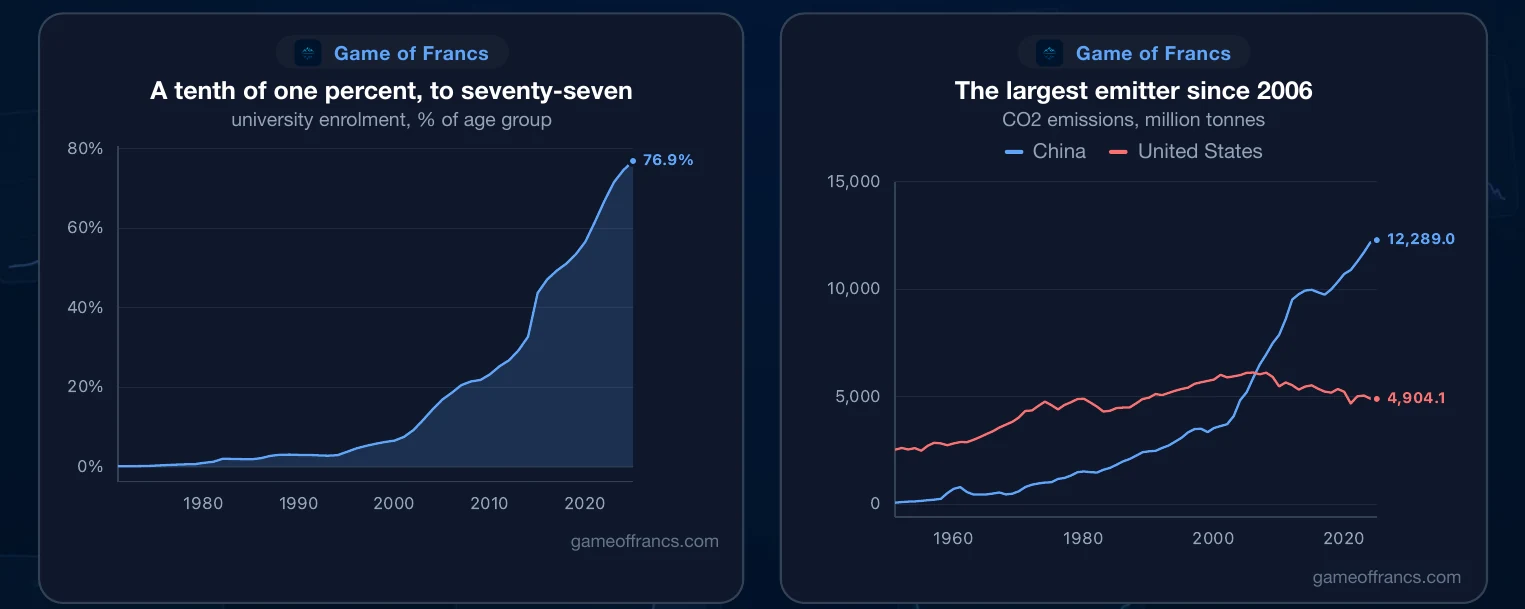
In 1970 a tenth of one percent of young Chinese went to university. Today 77% do. Researchers per million people have multiplied almost fivefold since 1996, and China has published more scientific articles than the United States every year since 2017. It now publishes more than twice as many.
The cost shows in the air. China has emitted more carbon dioxide than the United States since 2006, and today two and a half times as much. Per person it is still well below the American level: 8.7 tonnes against 14.2. The air, though still polluted, is cleaner than at its 2011 worst, and forest cover has grown from 17% of the land in 1990 to 24%. Nine in ten Chinese are online.
XVI. Who Took the Income
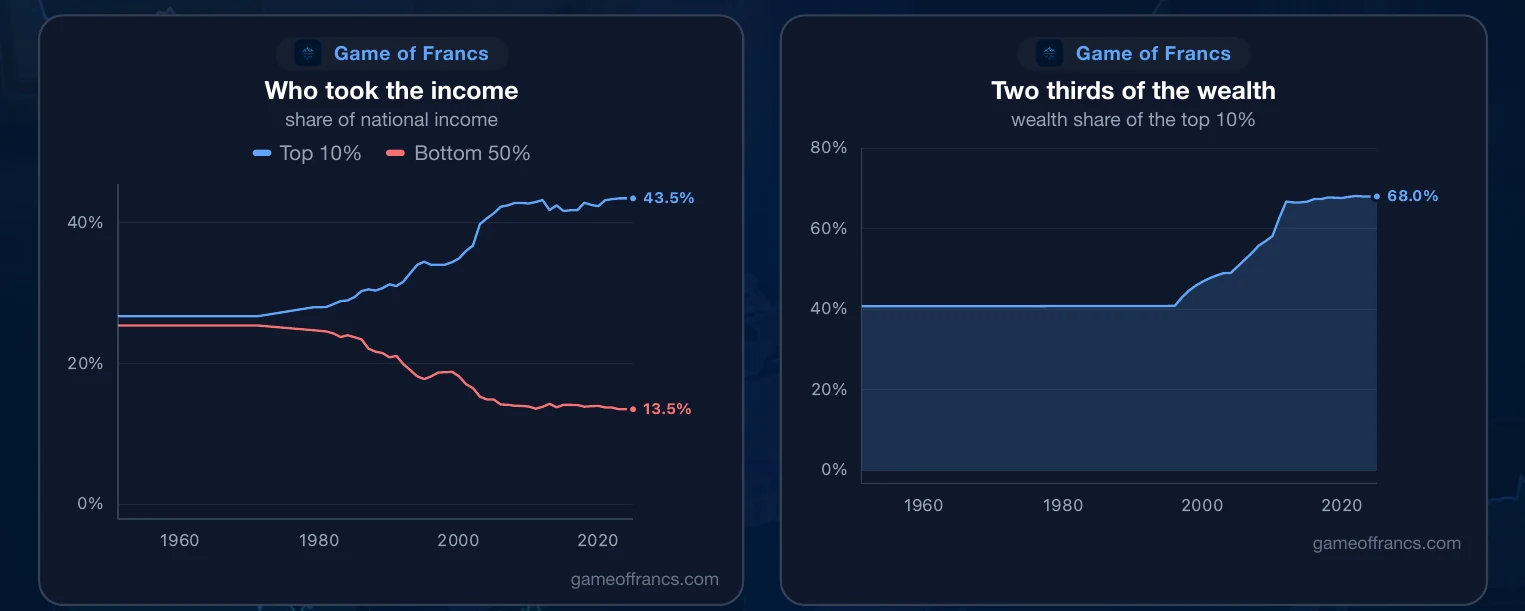
The gains were not shared equally. In the 1960s and early 1970s the top tenth of earners took about 27% of national income. Today they take 43%. The bottom half's share has fallen from 25% to under 14%.
Wealth is more concentrated still: the top tenth hold 68% of it. And the top tenth's share of income, 43%, is now close to America's 47%.
XVII. Power and the Cycle
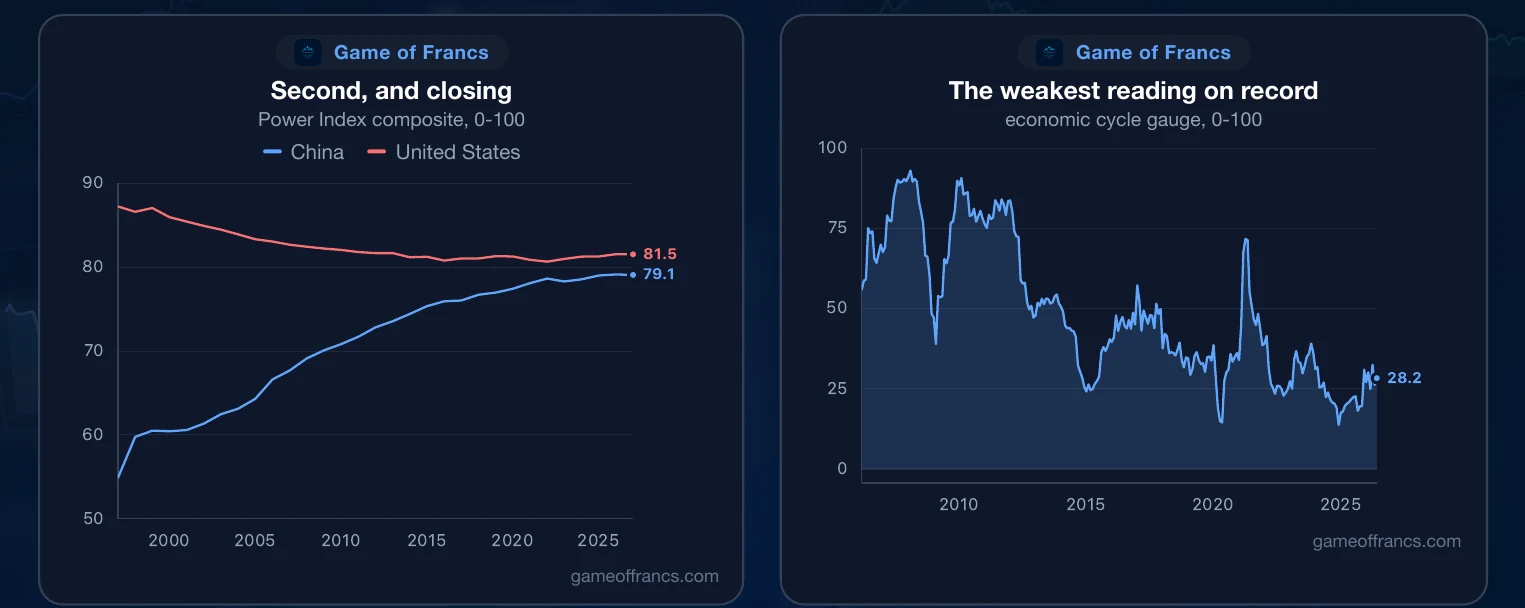
States. It has ranked second since 2005, and its composite has risen from 55 in 1996 while America's fell from 87. On trade it scores 100 out of 100. On reserve currency it scores zero: the yuan is still not money the world saves in.
And the economic cycle? China's cycle gauge fell to 14 out of 100 at the end of 2024, the weakest reading in its history. It has only partly recovered, to 28.
A country of 1.4 billion people, now shrinking and ageing; the world's workshop and its largest emitter; richer than it has ever been, and slowing. That is China, told in charts.
Get the next article by email
One email when a new piece is published. Nothing else, and one-click unsubscribe from any message.