
The Sovereign Debt Crisis
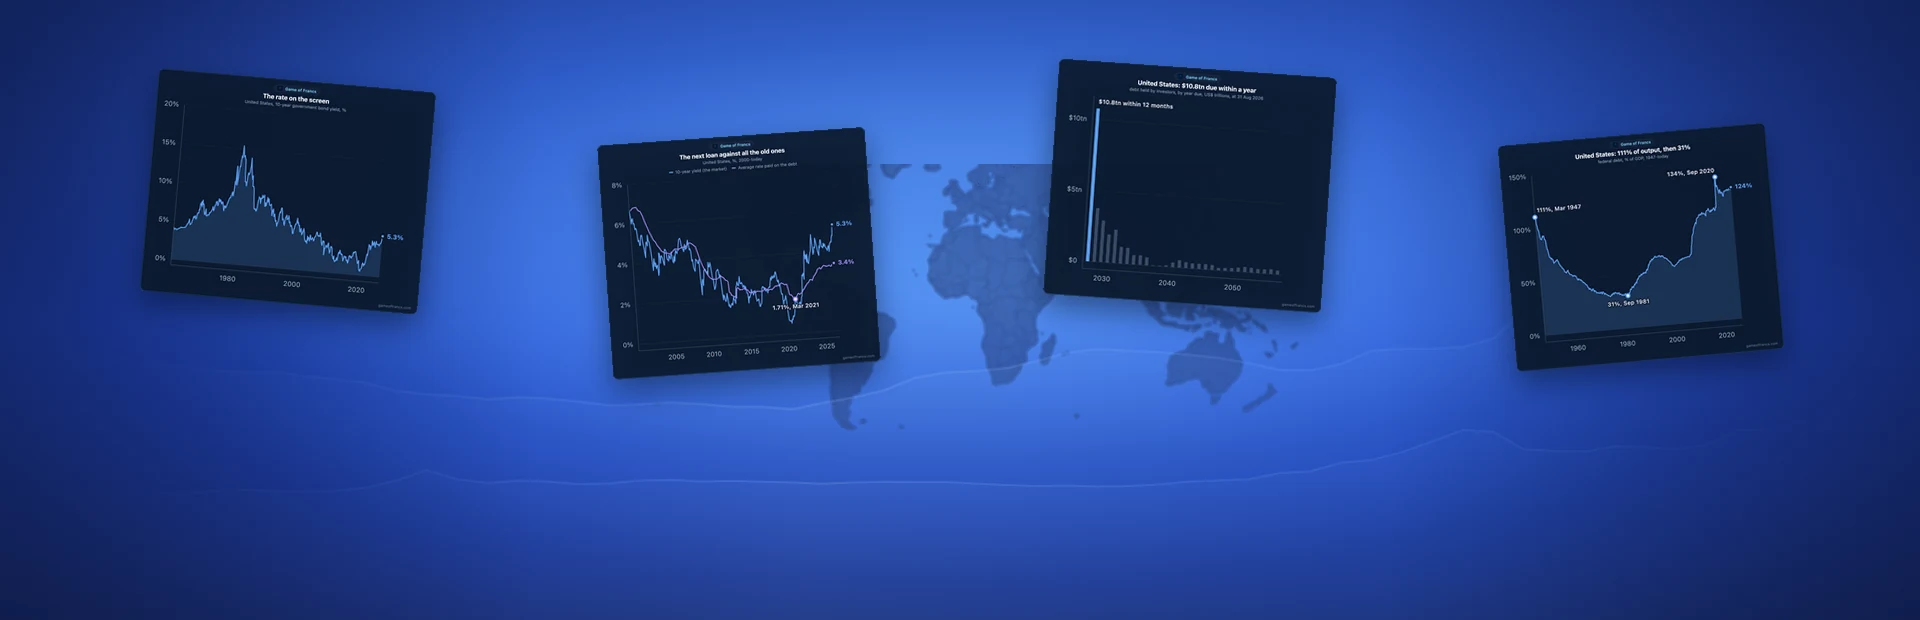
Long-term borrowing rates are at their highest in twenty to thirty years in the United States, Britain, Japan and France, and the headlines call it a sovereign debt crisis. Yet none of these governments pays those rates on what it already owes. The crisis is on the screen and not yet in the budget. This commentary is about the gap between the two: why it exists, how it closes, and how debts like these have usually ended.
by Game Of Francs Research Team

I. The Screen
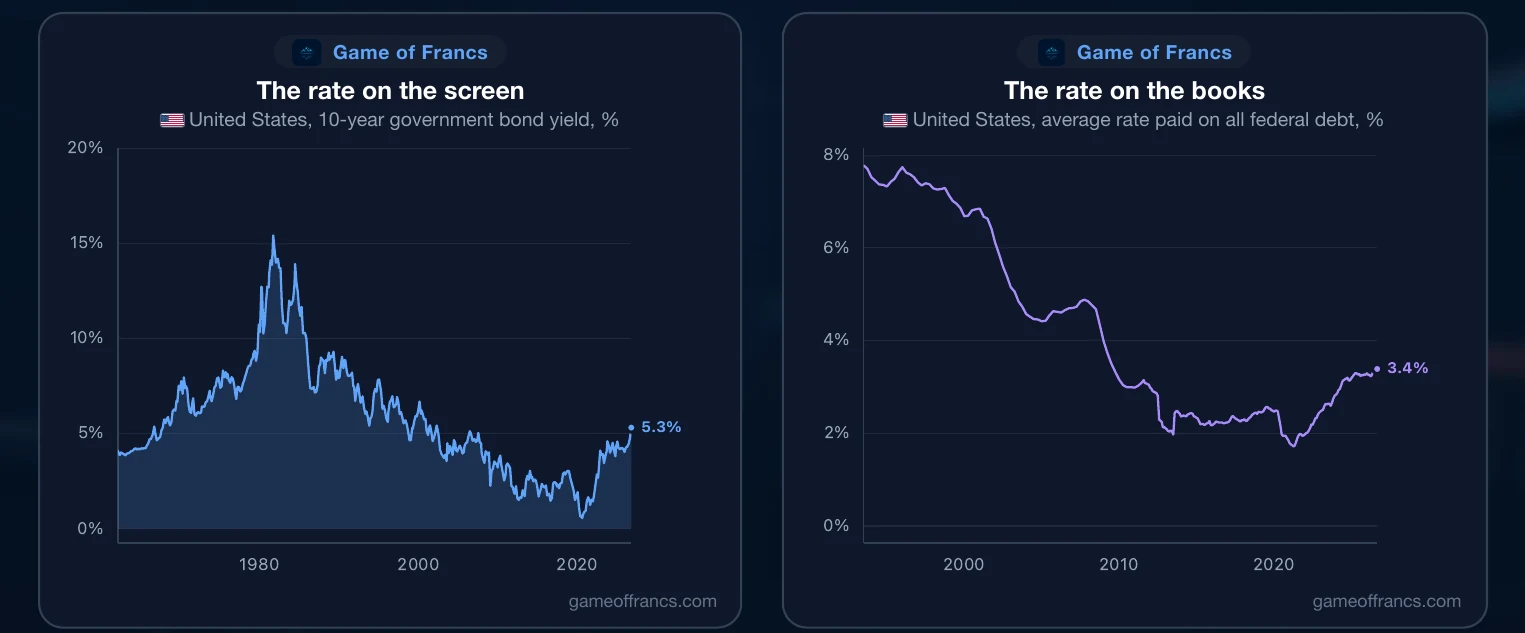
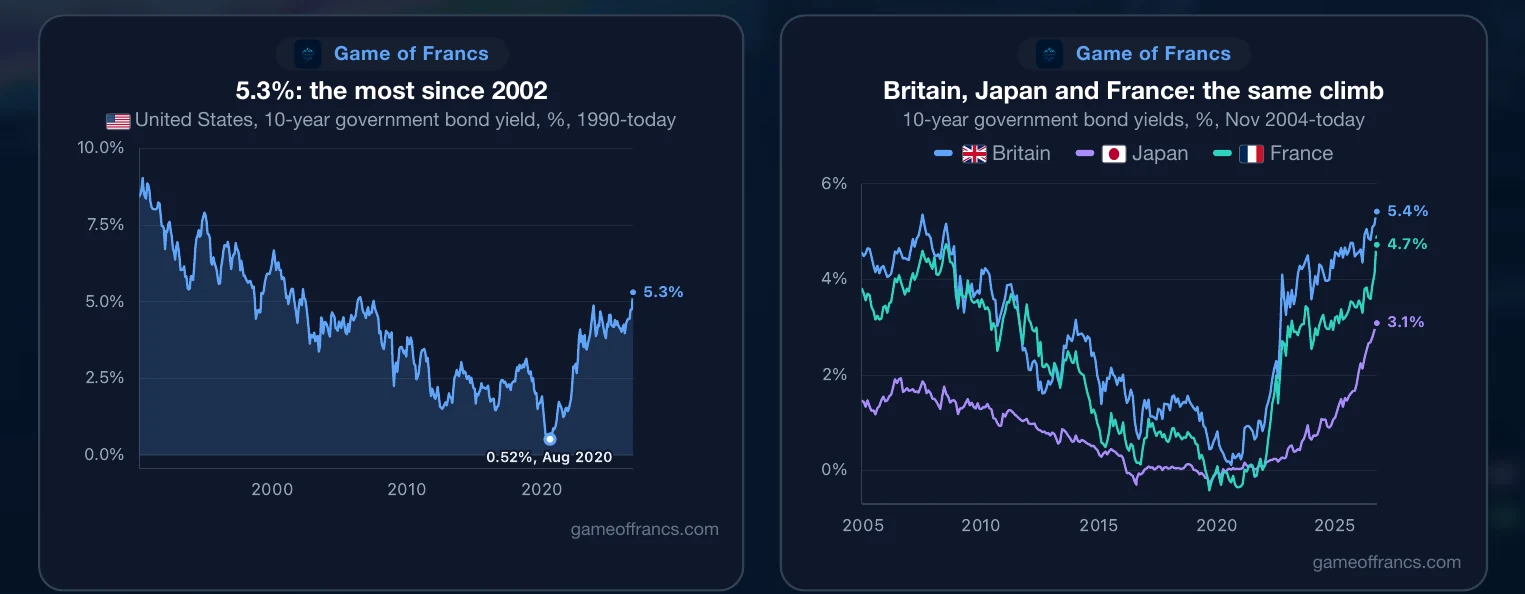
On 2 October 2026 the United States paid 5.28% to borrow for ten years. Two days earlier it had paid 5.29%, the most since May 2002. Britain paid 5.35% that day, after 5.42% the day before, the most since July 2007. Japan paid 3.10%, the most since August 1996. France paid 4.90%, a shade under the 4.903% of the day before, which is the highest in a daily record that begins in November 2004.
The distance travelled is the story. On 30 December 2021 the same four ten-year rates were 1.52% in the United States, 0.98% in Britain, 0.10% in France and 0.09% in Japan. In under five years the price of a ten-year loan has risen by almost four points in America, more than four in Britain, almost five in France and three in Japan.
That is the headline, and it is real. It is also only one of two numbers that matter.

II. France and Its Neighbours
Inside the euro area the ranking has moved as well. The latest German and Italian ten-year rates are older than the others, so each is set here against France on its own day.
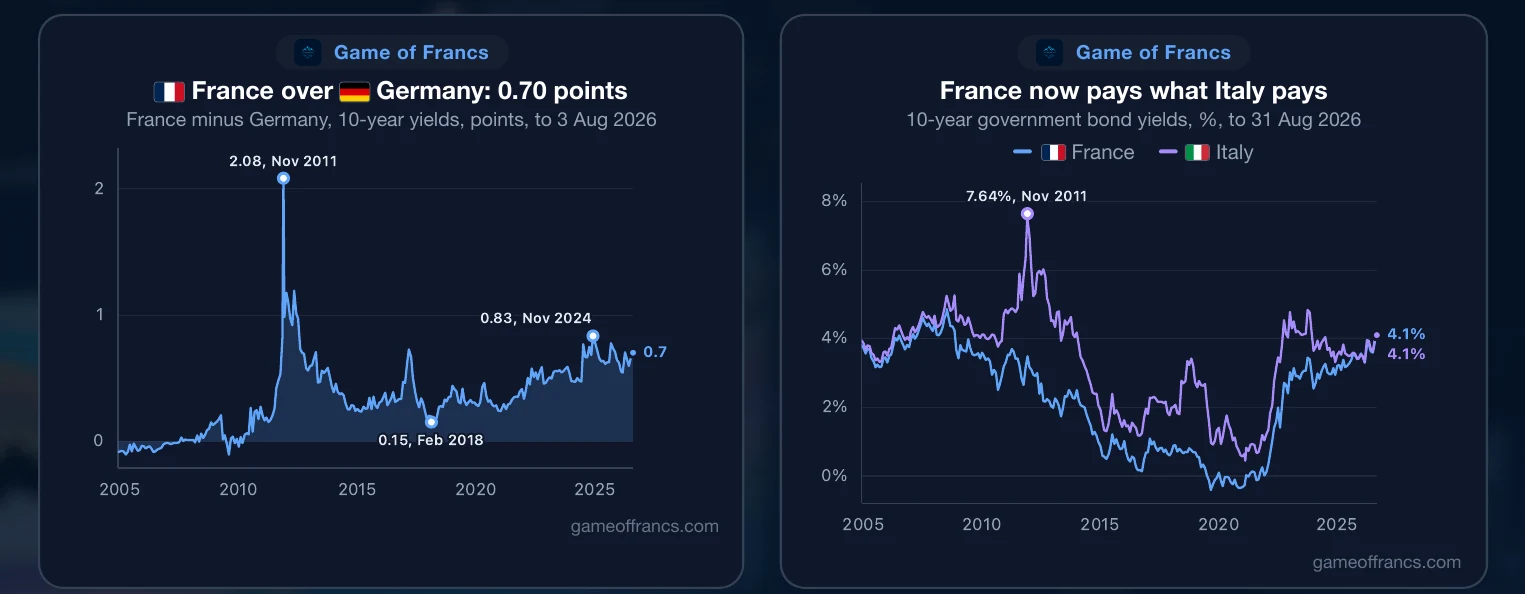
On 3 August 2026 Germany paid 3.21%, a level it had not seen, before this year, since June 2011. France paid 3.91% that day: 0.70 points more. In January 2021 the difference had been 0.24 points.
Italy shows the change best. At the end of 2022 Italy paid 4.77% and France 3.02%: one and three quarter points more. On 31 August 2026 Italy paid 4.10%, the most since December 2023, and France paid 4.11%. France now borrows at Italy's price. And in March 2026, the latest month for which there is a Greek figure, Greece paid 3.71% on average and France 3.65%: less than a tenth of a point between them.
 FranceInterest Rates
III. The Books
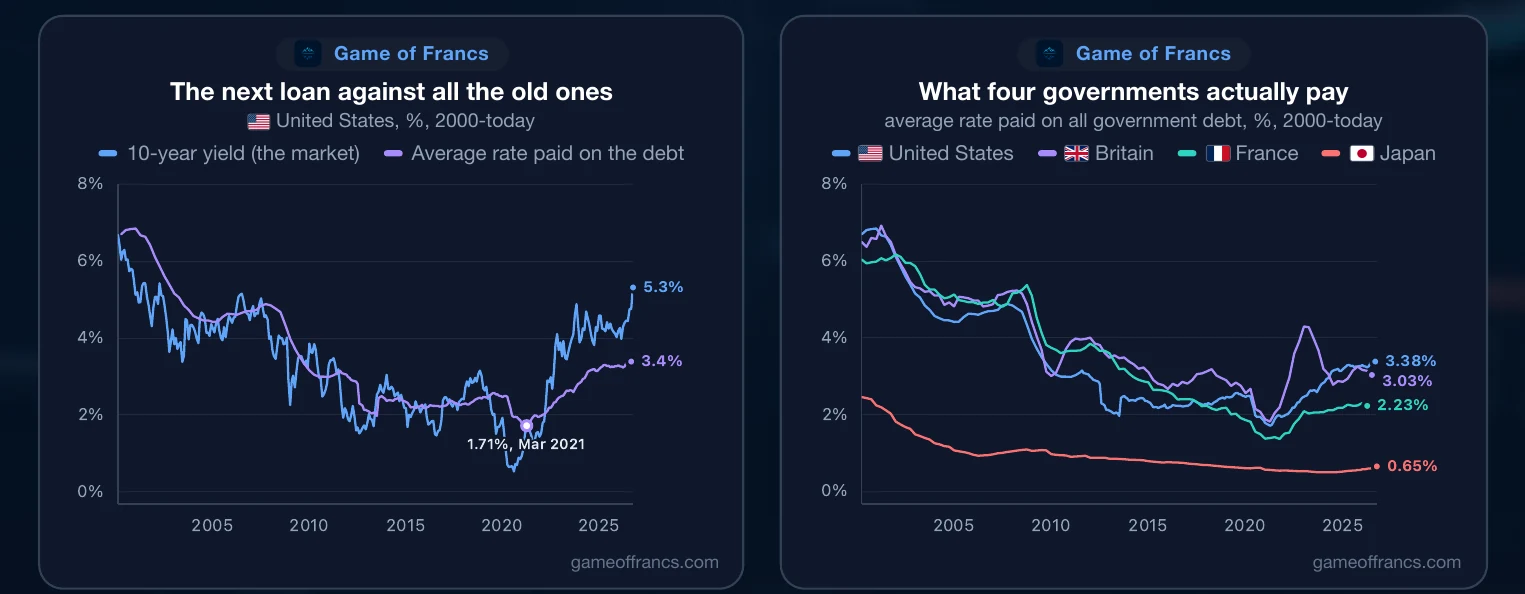
Now look at what these governments actually pay. Across everything it owes, the United States pays an average of 3.4%. Britain pays 3.0%. France pays 2.2%. Japan pays 0.65%.
The market rate is the price of the next loan. The budget pays the price of all the old ones. Between the two there is a gap: 1.9 points in America, 2.3 in Britain, 2.4 in Japan and 2.7 in France.
The average has started to move. America's reached a low of 1.71% in March 2021 and has almost doubled since. France's low was 1.37%, in September 2021. Japan's came last, 0.50% in June 2024. But in every case the rate on the books is still far below the rate on the screen, and the whole question is how fast the one climbs to the other.
IV. The Ladder
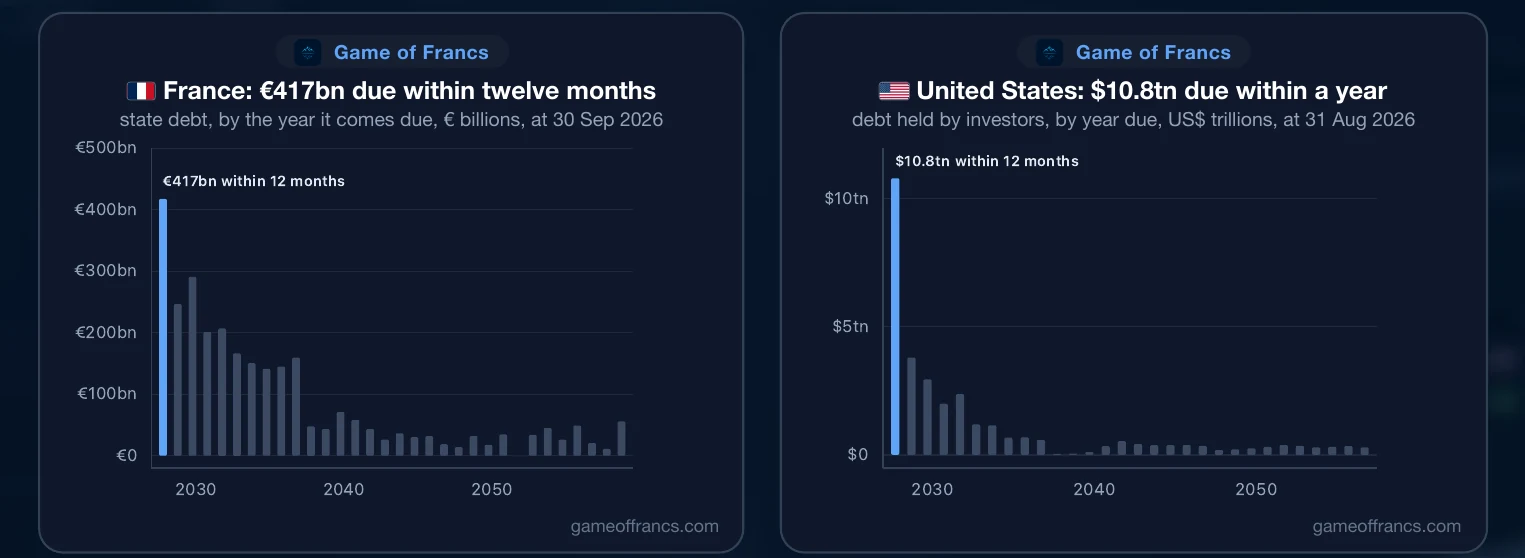
A government does not have one debt. It has thousands of separate bonds, each sold on a different day, each at a rate fixed until the day it is repaid. A bond sold in 2021 at half a percent still costs half a percent today. When it comes due, it is repaid with a new bond, at today's rate. So what matters is how much comes due, and when.
In France, €417 billion of state debt comes due within twelve months: 14.5% of the total, one euro in seven. Germany is in the same place, at 14.4%. Japan is at 17.3% and Canada at 19.1%.
The United States moves fastest. It leaned on short-term bills, and $10.8 trillion, a third of the debt it has sold to investors, comes due within a year. Within five years it is 68%, against 47% in France. Its debt runs 5.8 years on average.
Britain moves slowest. Its debt runs 13 years on average, and only 5.5% of it, one pound in eighteen, comes due within a year. That is why the highest long-term rate of the four does the least immediate damage.
V. The Arithmetic
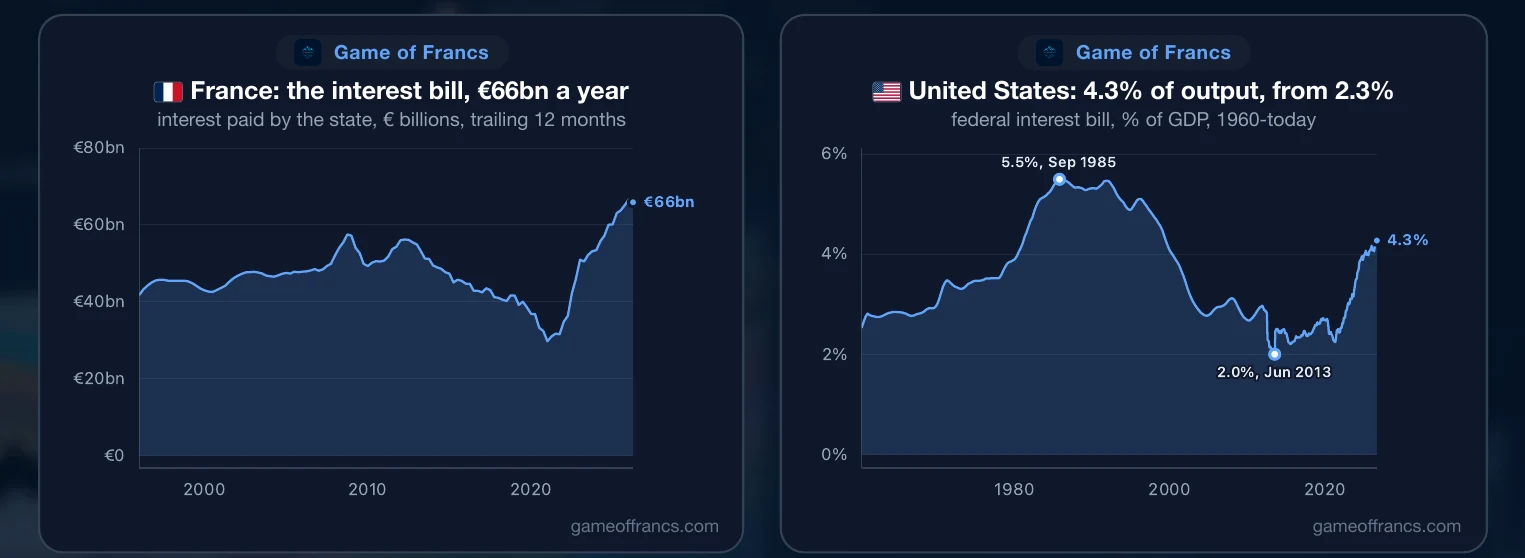
Now run the arithmetic to the end. France pays €66 billion a year in interest. If every French bond were replaced at today's ten-year rate, the bill would be about €145 billion. America's would go from $1.36 trillion to about $2.1 trillion. Japan's would be 4.8 times what it is, and would take 53% of what the government collects, against 11% today.
That is not a forecast. Rates can fall, bills and short bonds are replaced at lower rates than ten-year ones, and Japan's central bank still holds 41% of its government's bonds, so part of what Tokyo pays comes back to it. The sum measures one thing only: the distance between the rate on the books and the rate on the screen.
Some of that distance has been crossed already. Interest costs America 4.3% of its output, against 2.3% at the end of 2020. The record, 5.5%, was set in 1985.
VI. Why Now
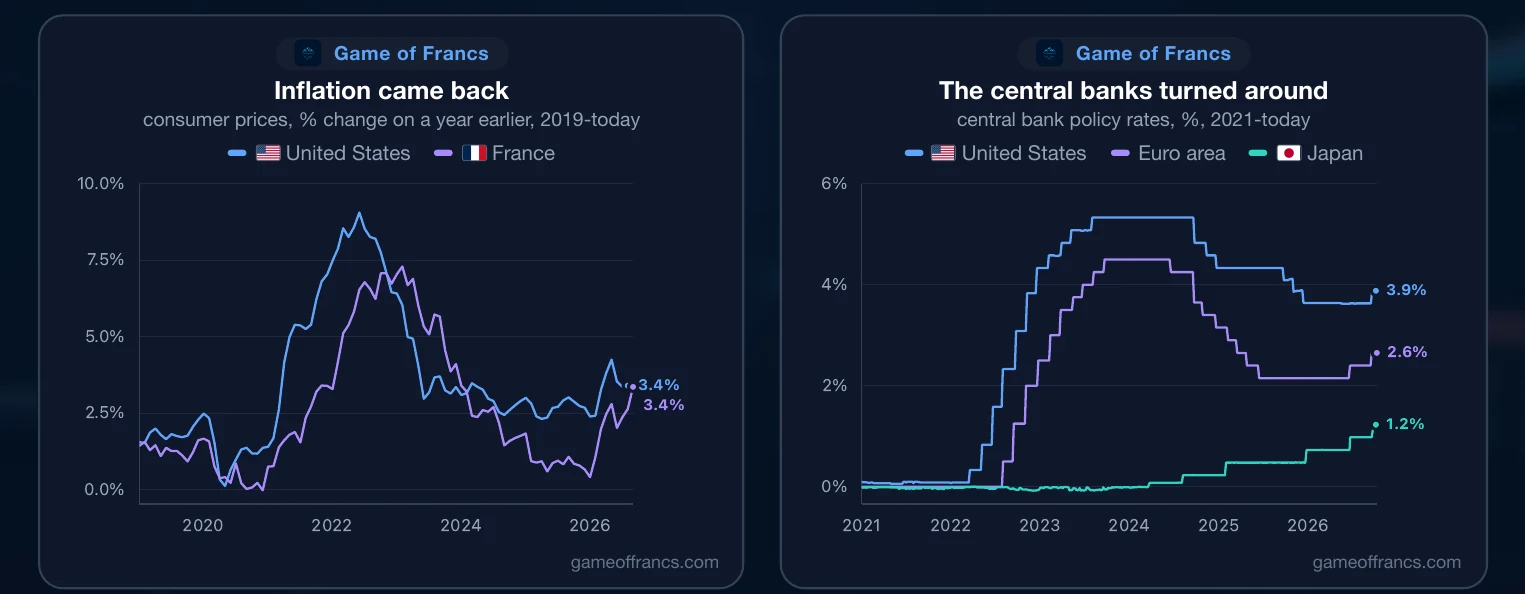
Why are rates rising now? Because inflation came back. American prices were rising 2.4% a year in January 2026 and 4.25% in May, the fastest since April 2023. French inflation went from 0.4% in January to 3.4% in September.
So the central banks turned around. The Bank of Japan has raised its rate three times since December 2025. The European Central Bank raised in June and again in September. And on 17 September America's central bank raised its rate for the first time since July 2023.
Britain is the exception that shows the limits of that explanation. The Bank of England has not moved since December 2025, and Britain's ten-year rate has still risen 0.78 points this year. Something else is at work.
VII. Who Buys
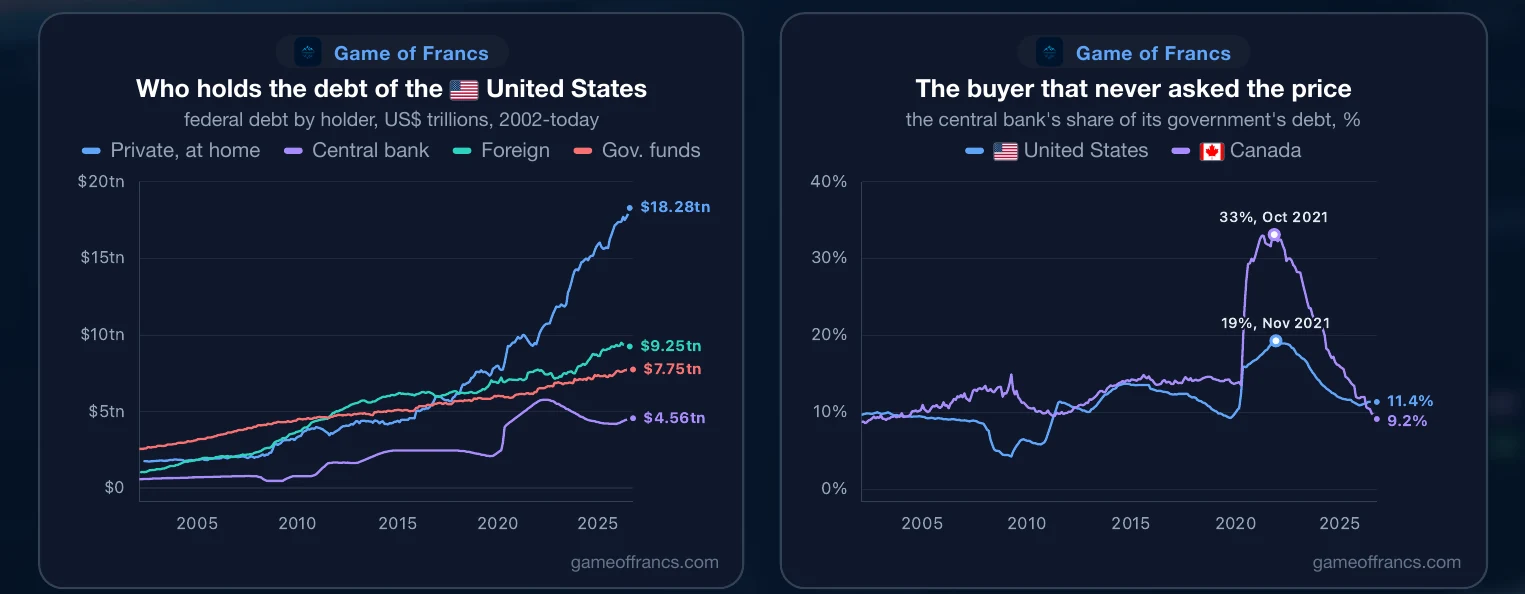
The second reason is about who buys the bonds. For a decade the biggest buyer was the central bank, and it never asked the price. At the end of 2021 America's central bank owned 19% of all federal debt. Today it owns 11%.
Between June 2022 and July 2026 the federal debt grew by $9.2 trillion. The central bank's holdings fell by $1.2 trillion. Foreign investors took $1.8 trillion and the government's own funds $1.1 trillion. American private investors took $7.5 trillion.
It is the same elsewhere. The Bank of Japan holds ¥115 trillion less than at the end of 2023. The Bank of Canada held a third of its government's bonds in 2021 and holds 9% now.
A central bank buys whatever the price. A pension fund or a foreign investor buys only if the yield is worth it. The buyers who are left ask for more.
VIII. Growth Against the Rate
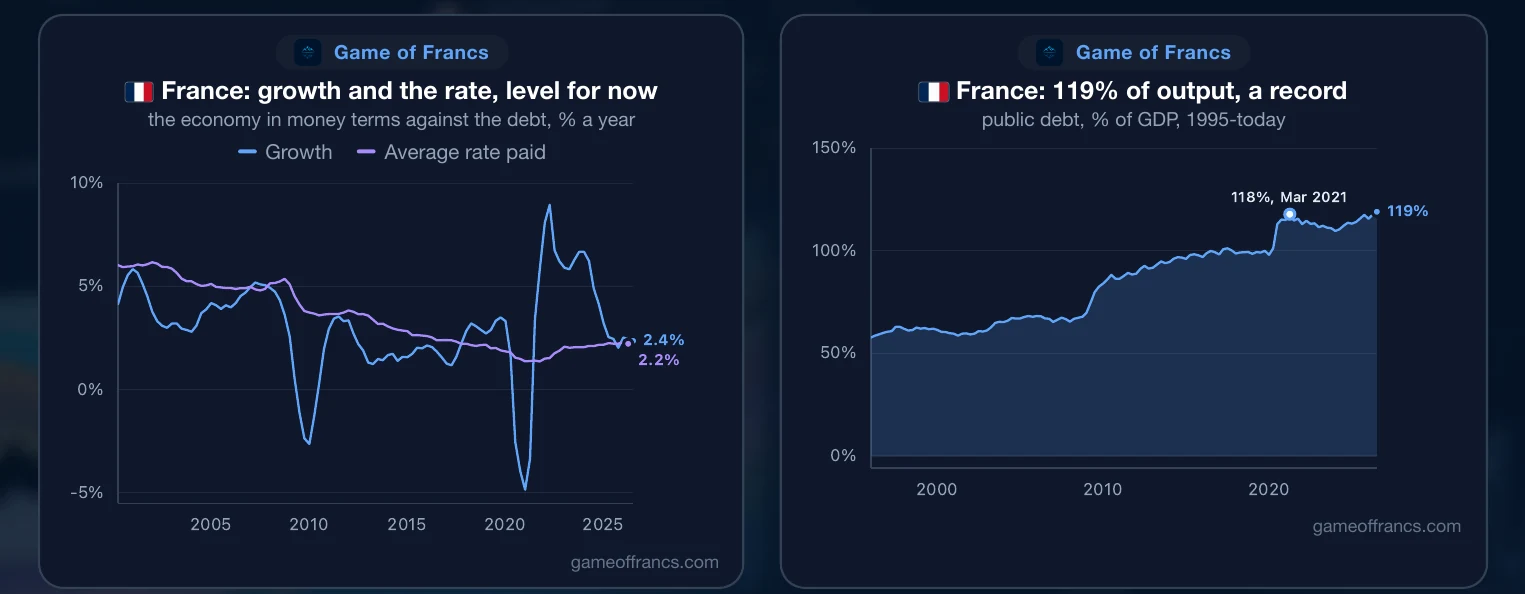
A debt is stable when the economy grows as fast as the rate paid on it. France's economy is growing 2.4% a year in money terms. Its debt costs 2.2%. For now, the two cancel out.
At 4.9% they do not. On a debt of 119% of output, that difference adds three points of debt every year, before a single new euro is spent. And the French state already spends 5.1% of output more than it collects.
This is where the loop closes. A higher bill means a wider deficit. A wider deficit means more bonds. More bonds, sold to buyers who can say no, mean a higher rate. In the second quarter of 2026 French public debt reached 119% of output, a record, above the 117.8% of early 2021.
IX. What Says No
So is this a crisis? Some of the evidence says no.
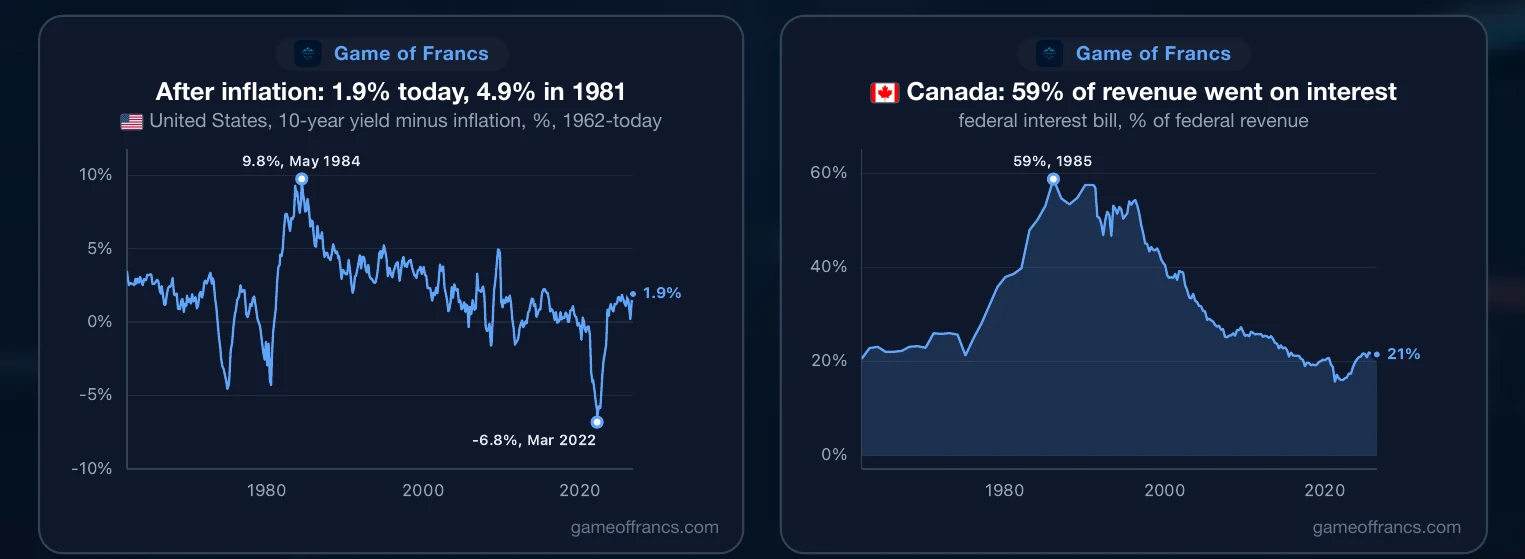
Take inflation off, and America's ten-year rate is 1.9%. In September 1981 it was 4.9%, on a rate of 15.84%. Interest took 59% of Canada's federal revenue in 1985, and Canada did not default. Italy paid 12.7% of its output in interest in 1993, against 3.8% now. France's own record is 6.0% of output, in 1924, against 2.2% today. Britain's bill has fallen, from 4.3% of output at the end of 2022 to 3.1%.
And two of these economies are still outrunning the rate. America's is growing 6.8% a year in money terms, faster than the 5.3% on its new debt. Japan's is growing 4.2%, against 3.1%. Worse has been survived.

X. The Usual Exit
But look at how debts like these have ended. Governments that borrow in their own money rarely default. They rarely repay, either. Canada did, with eleven budget surpluses in a row from 1997 to 2007, and it is the exception. The usual choice is inflation.
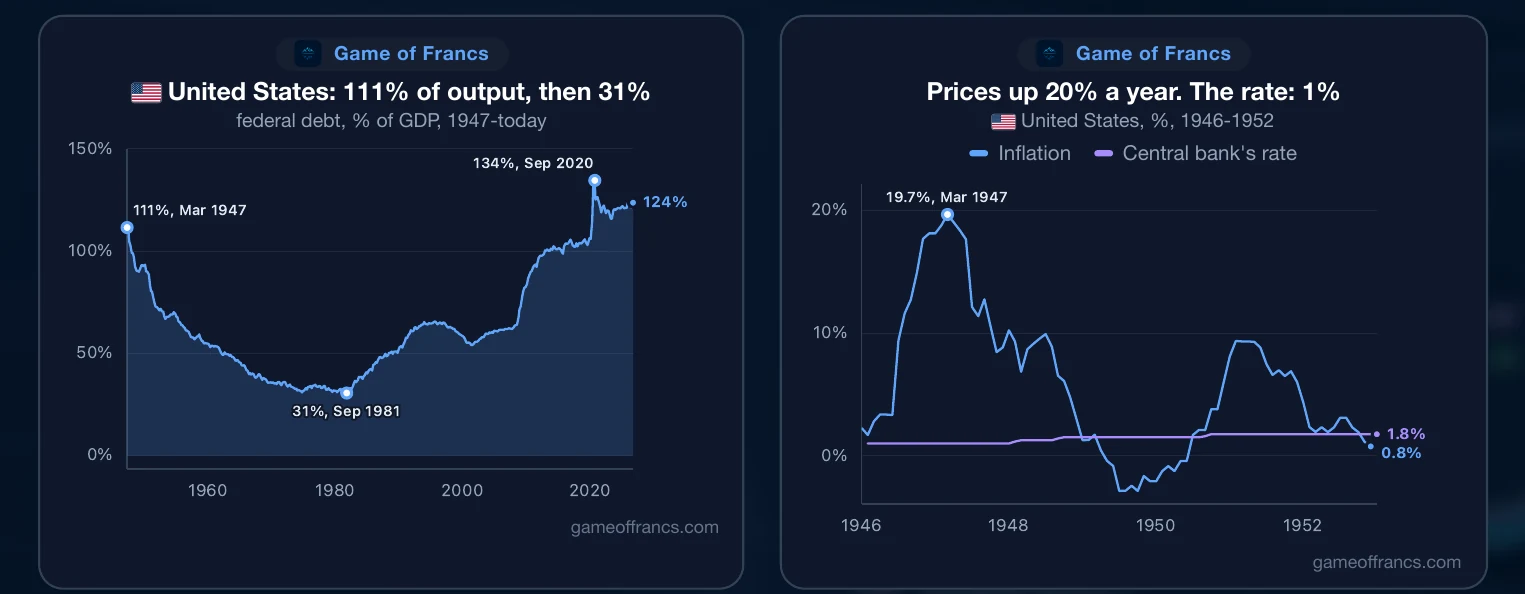
In March 1947 American federal debt was 111% of output. By September 1981 it was 31%. None of it had been repaid: the debt had more than tripled, from $271 billion to $998 billion. What changed was the size of everything else. Prices rose 4.3 times over, and the economy, counted in dollars, grew 13.4 times over.
The saver paid for it. In March 1947 prices were rising almost 20% a year and the central bank's rate was 1%. Its rate stayed below inflation in 55 of the 72 months from 1946 to 1951. A dollar lent to the government in March 1947 bought less than a quarter as much in 1981.
France did it twice. The franc lost 99% of its value in gold between 1913 and 1959, and the money that replaced it has lost 99% again since 1960.
XI. It Has Just Happened Again
Between September 2020 and April 2023 American federal debt fell from 134% of output to 116%, while the debt itself grew from $26.8 trillion to $31.5 trillion. Prices rose 17%.
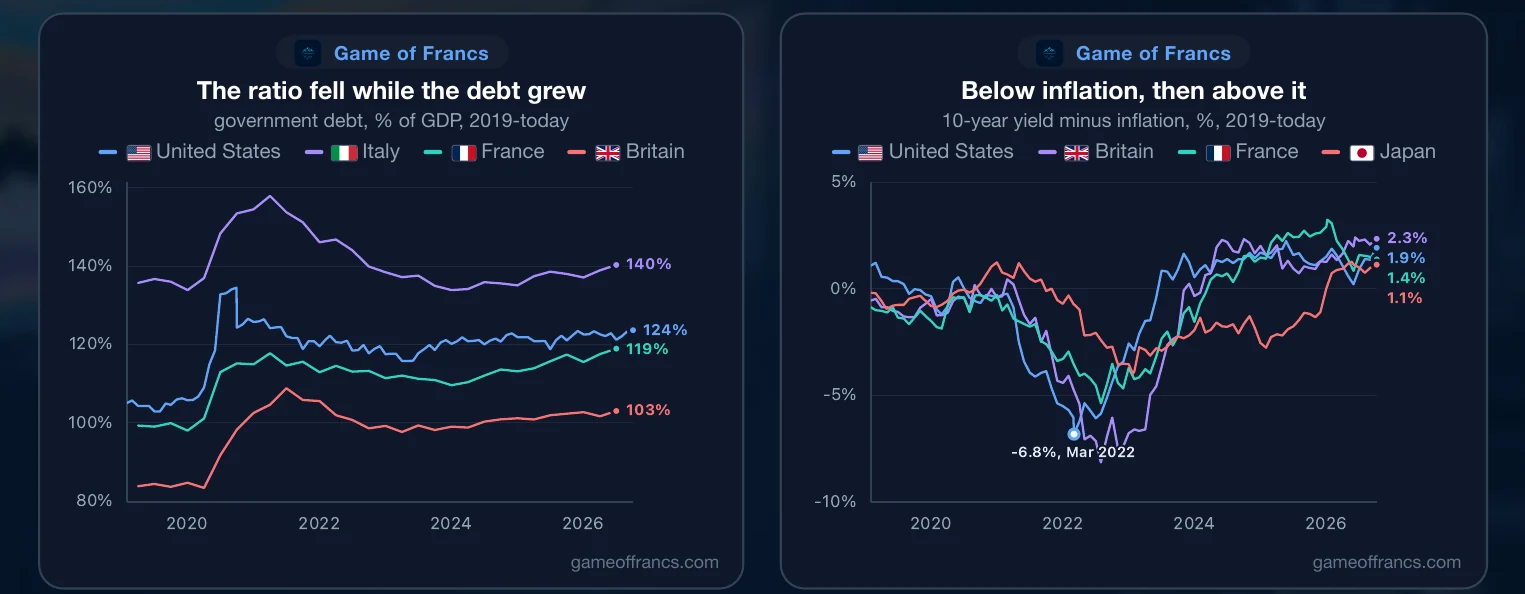
It was not only America. Italy's ratio fell 24 points, from 158% in early 2021 to 134% at the end of 2023. Britain's fell from 109% to 98% while prices rose 16%, and France's from 118% to 110% while prices rose 14%. The debts shrank the old way.
Lenders paid again. Through all of 2021 and 2022 America's ten-year rate was below inflation on every single trading day. On 1 March 2022 it was 1.72%, with prices rising 8.5%: almost seven percent a year lost by the lender. Gold kept the score. Even 23% below its January record, it costs almost three times what it did at the end of 2019.
XII. Conclusion
The sovereign debt crisis is real, but it is not where the headlines put it. It is not in this year's budgets: governments are still paying yesterday's rates on most of what they owe. It is in the distance between those rates and the price of the next loan, and that distance closes on a known schedule.
Three things follow. First, the bill rises whatever happens next, because every bond that comes due is replaced at today's price: €417 billion in France and $10.8 trillion in the United States within a year. Second, the debts have stopped shrinking against the economy. France's ratio is at a record, Italy's is back at 140% of output, Britain's at 103% and America's at 124%. Third, the usual way out is harder than it was. Inflation shrinks a debt only while lenders accept a rate below it, and they no longer do: after inflation a ten-year loan now pays 1.9% in America, 2.3% in Britain, 1.5% in France and 1.1% in Japan.
That leaves the choices governments have always had: spend less, tax more, grow faster, or let prices rise faster than rates. History shows which one they usually reach for, and the bond market is now charging for it in advance.
So watch two numbers: the rate on the screen and the rate on the books. The crisis ends when they meet. The only question is which of the two moves.
Get the next article by email
One email when a new piece is published. Nothing else, and one-click unsubscribe from any message.