

The Debt Trap
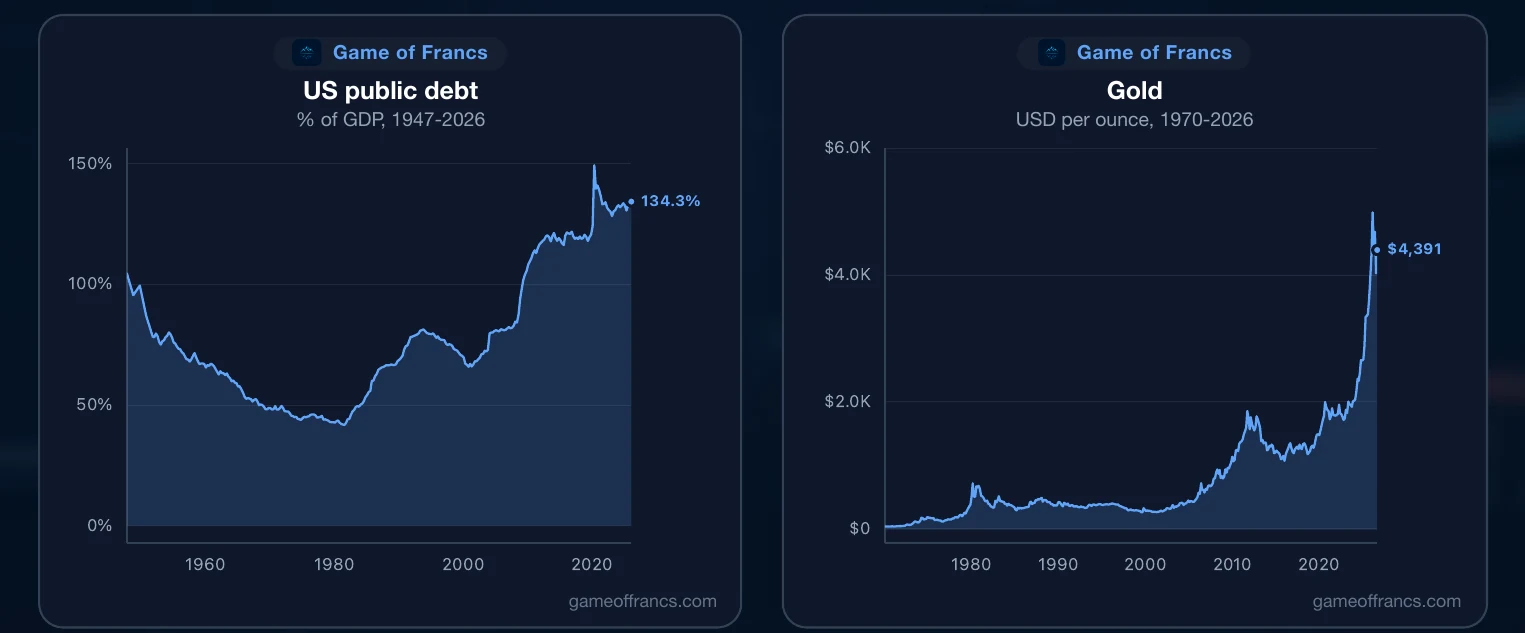
Three stories dominate the macro tape: an American fiscal position that no longer stabilises on its own, a world rearming faster than at any point since the Cold War, and a gold price that has quadrupled in a decade. Markets file them separately. They are the same story, told from three angles, and the data now says where in the long debt cycle we are standing.
by Game Of Francs Research Team

I. Three Things at Once
Every market narrative has a filing system. Fiscal deficits go in the politics folder, wars go in the geopolitics folder, and gold goes in the commodities folder, somewhere between copper and cocoa. The filing is tidy and it is wrong. What is happening across these three files is one process: a long debt cycle entering the phase where the arithmetic of the debt stops being a background condition and starts being the constraint on everything else.
The mechanism is not mysterious. A government that has borrowed heavily at low rates must eventually refinance at higher ones. As it does, the interest bill grows faster than the economy, which means the deficit widens even if the government spends nothing new. That widening deficit issues more bonds into a market that is already digesting a record supply, which pushes the long end higher, which raises the refinancing cost again. At the same time, the geopolitical environment demands the one category of spending that no democracy can easily cut, and the institutions that hold the world's savings begin quietly rebuilding the one reserve asset that is nobody else's liability.
None of this is a forecast. Each link in that chain is now measurable, and most of them have already moved. This piece walks through the measurements: what the American ledger actually says, why the burden looks like the 1980s but is structurally worse, how far the trap has closed on the other major economies, what rearmament does to the fiscal arithmetic, and why gold has gone from a legacy holding to roughly a quarter of the world's official reserve assets in a single decade.
II. The American Ledger
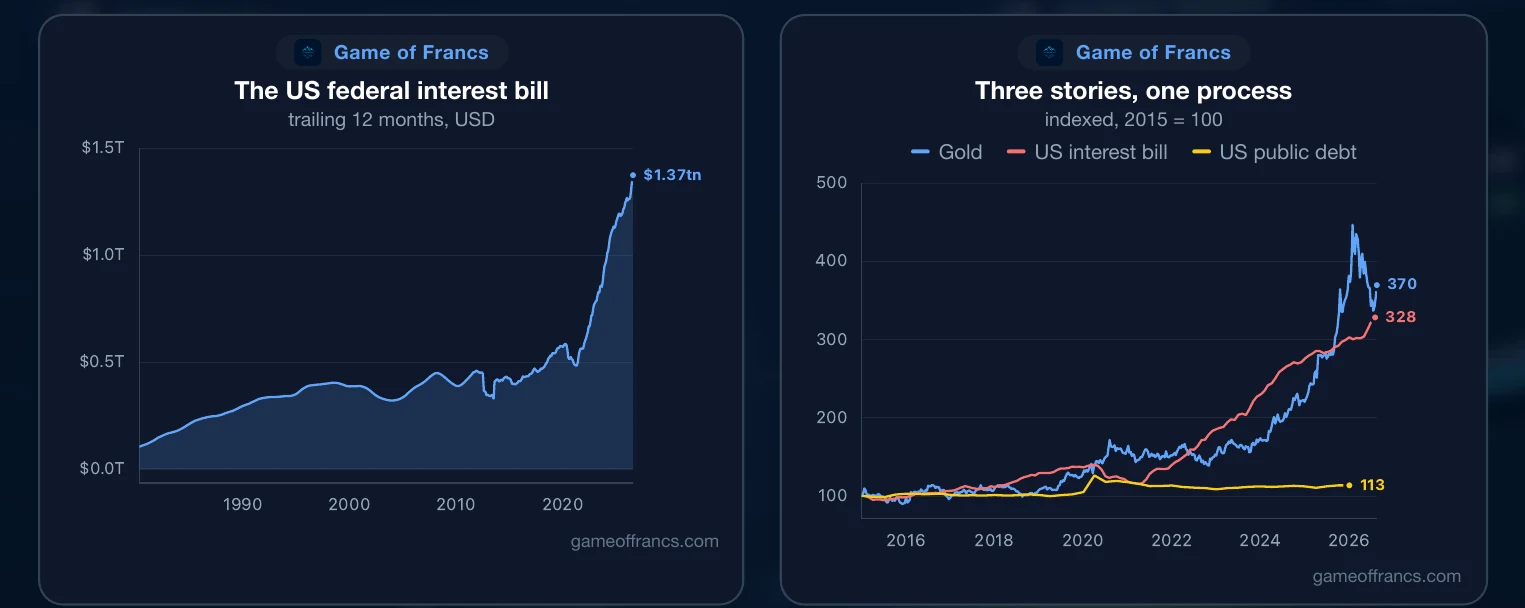
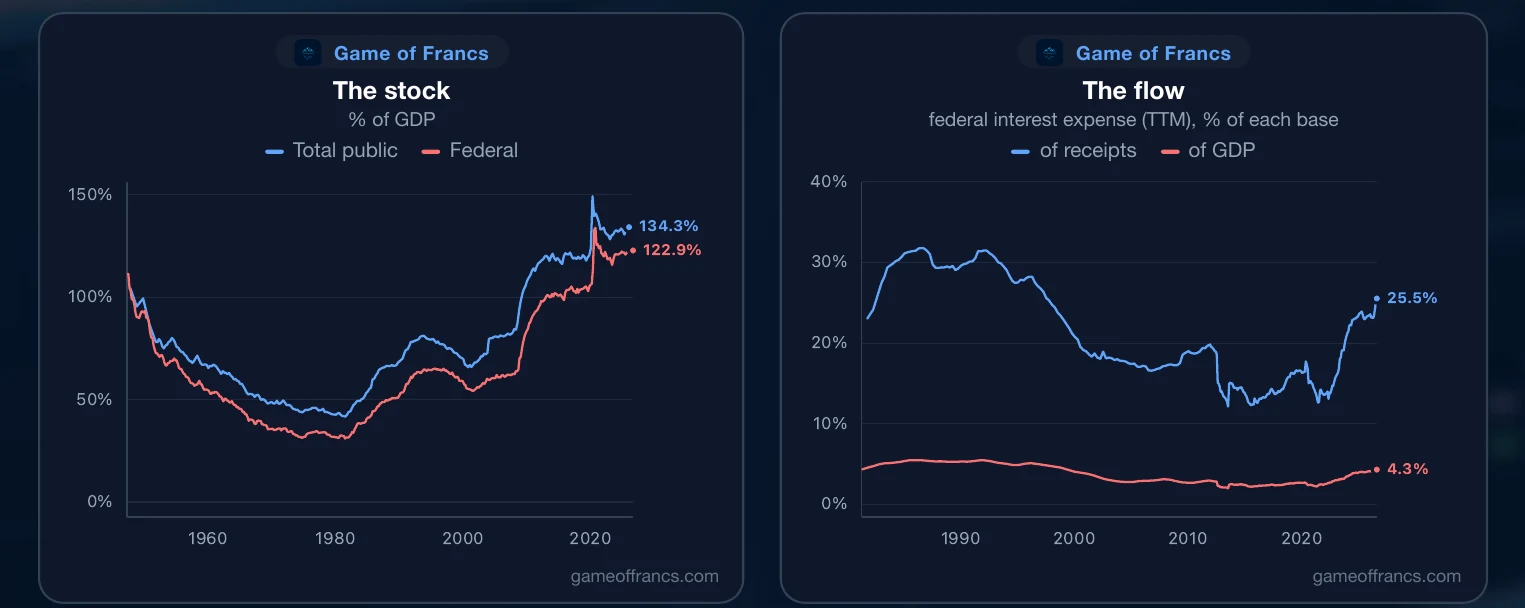
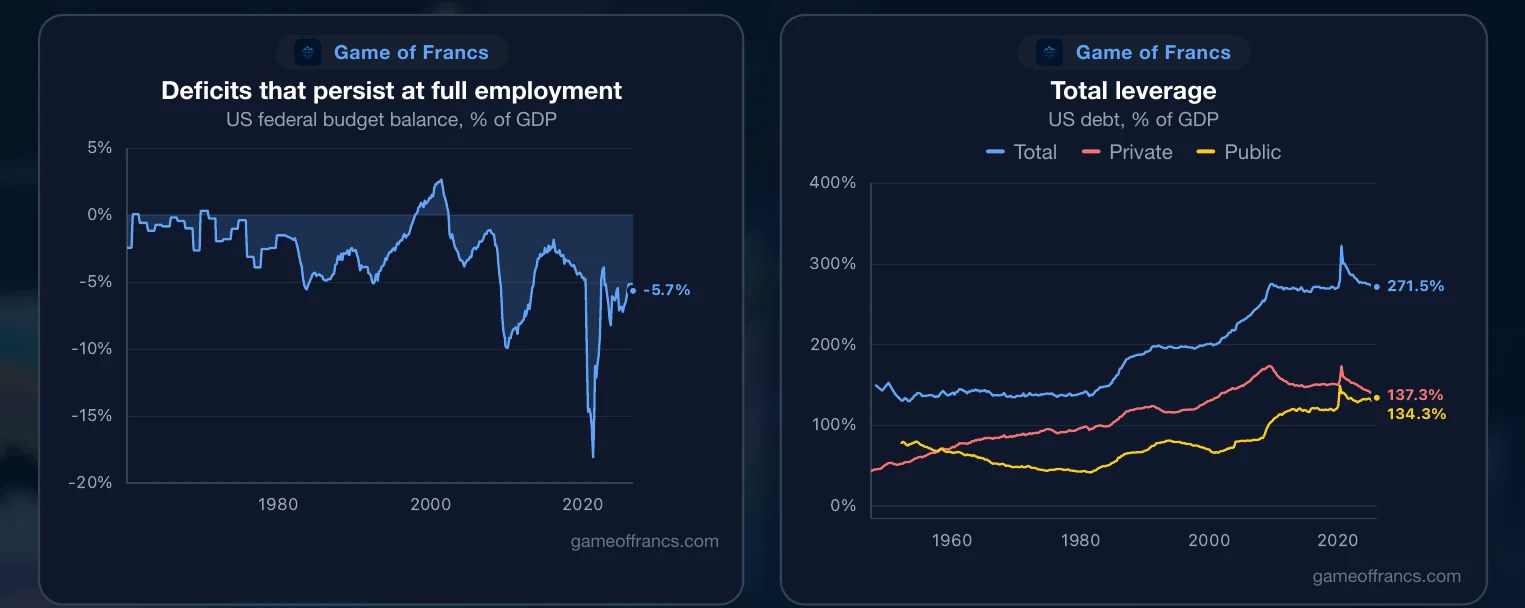
Start with the stock. Total US public debt reached 134.3% of GDP in the first quarter of 2026, up from 120.6% at the end of 2019 and 82.9% at the end of 2007. Federal debt alone stood at 122.8% of GDP in August 2026, against 58.3% at the close of 1999. The debt has roughly doubled as a share of the economy inside a single working career.
The stock, though, is the less interesting number. The flow is what bites. US federal interest expense on a trailing twelve month basis reached $1.373 trillion in July 2026. At the end of 2019 the same measure was $571 billion. The interest bill has therefore multiplied by 2.4 in six and a half years, and it now runs roughly 40% above what the United States spent on its entire military in 2025, which SIPRI puts at $954 billion.
Expressed against the things that have to pay for it, interest now absorbs 4.33% of GDP and 25.5% of federal receipts. One dollar in four that arrives at the Treasury leaves again before a single soldier, road, or retiree is funded. Both figures are the highest since the late 1990s: receipts last cleared 25% in 1997, and the GDP share last cleared 4.3% in the first quarter of 1999.
Around this, the deficit runs at 5.7% of GDP as of June 2026, in an economy that is not in recession and not at war on its own soil. Deficits of that size at full employment are what the cycle framework treats as the tell. This is not the borrowing of a government responding to a shock. It is the structural position of a government whose baseline no longer balances, and that distinction matters more than any single month's print.
III. The Burden Is Not New. The Stock Is.
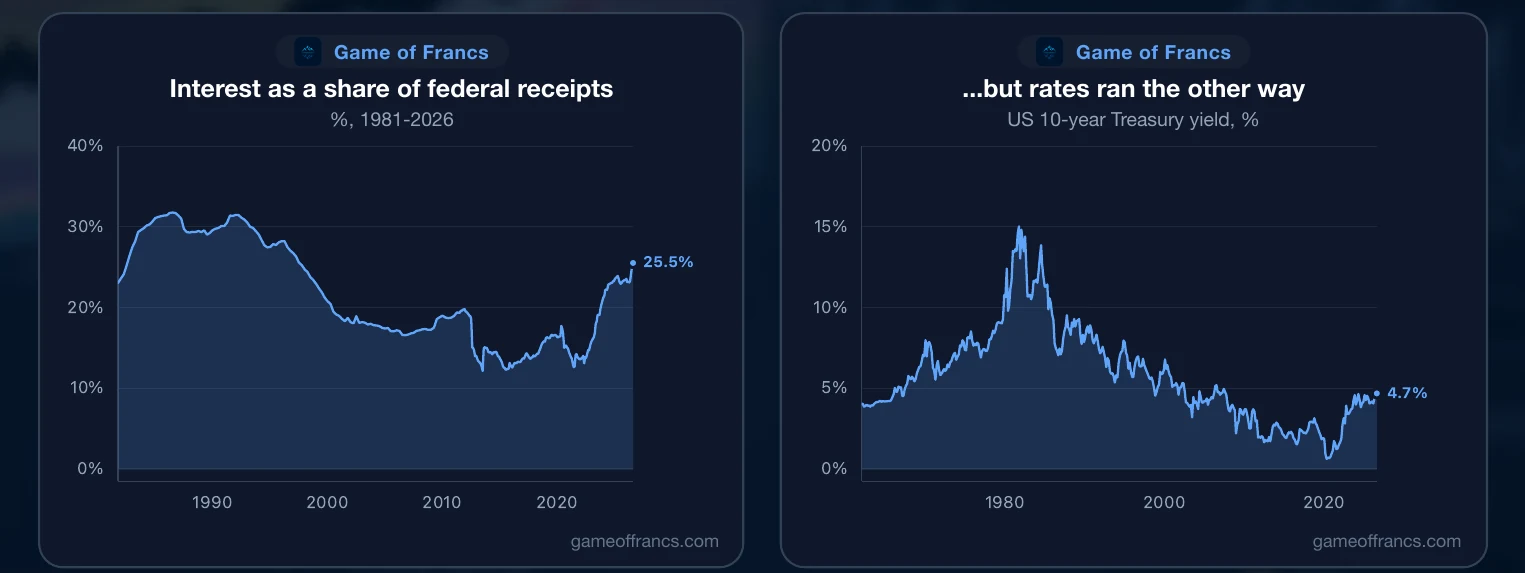
Here the honest comparison has to be made, because the alarming version of this story is also the lazy one. The United States has carried a heavier interest burden before. In September 1985 net interest ran to 5.50% of GDP, and in mid-1986 it absorbed 31.8% of federal receipts. Both exceed today's readings by a comfortable margin. The republic did not end. Anyone claiming the current burden is unprecedented is not reading the series.
The difference is not the burden. It is everything underneath it. In mid-1986, when interest consumed nearly a third of receipts, federal debt was 45.3% of GDP. Today it is 122.8%, nearly three times larger. And the direction of rates was the opposite: the 10-year Treasury yielded 7.35% in mid-1986 and was descending from a 1981 peak above 15%, which meant every year of refinancing lowered the average coupon on the debt. That descent ran for four decades and did the fiscal work of a generation of austerity, without a single vote.
Today the 10-year yields 4.68% and is ascending from a 2020 low near 0.5%. Every year of refinancing now raises the average coupon rather than lowering it. The 1980s burden was a peak on a mountain the country was walking down; the current one is a reading taken on the way up, on a debt stock three times the size. That is the asymmetry, and it is the entire argument. The 1980s comparison does not reassure. It clarifies.
There is a further wrinkle. A large share of the outstanding stock was issued at the exceptionally low coupons of 2020 and 2021, and it matures continuously. The average interest rate on the debt is therefore still catching up to market rates. Even if yields simply stayed where they are, the interest bill would keep climbing for years as old paper rolls into new. The trap does not require conditions to deteriorate. It only requires them to persist.
IV. The Long End Reprices
Which brings us to rates, the transmission mechanism between the debt and everything else. The striking thing about the current repricing is that it is happening at the long end, in the part of the curve that central banks do not set and that reflects, more than anything, what buyers require to lend for thirty years.
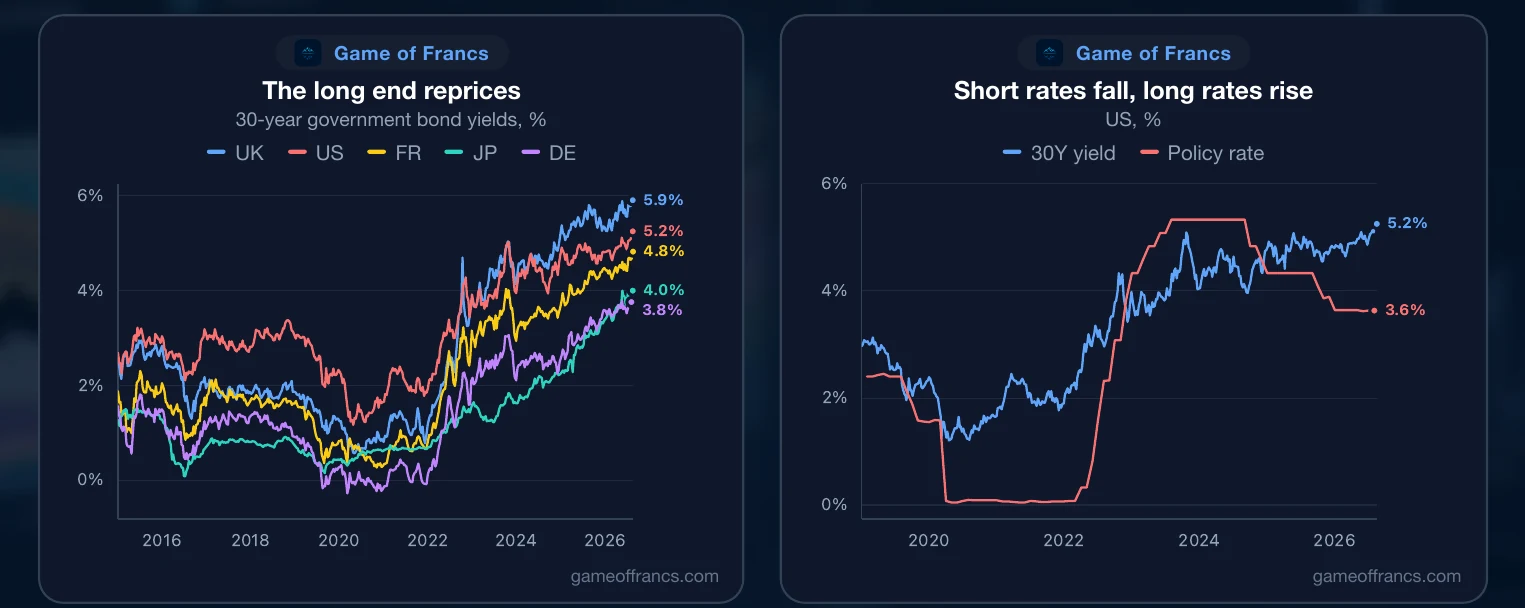
The 30-year US Treasury yields 5.24% as of 12 August 2026, comfortably above the 10-year at 4.68%. The curve has resteepened, with the 10-year over 2-year spread back at 48 basis points after years of inversion. But the truly instructive readings are abroad. The 30-year UK gilt yields 5.85%, against 1.35% at the end of 2019. The 30-year JGB yields 3.99%, against 0.41% at the end of 2019, a market that spent a quarter of a century as the world's proof that debt levels do not matter. The 30-year Bund yields 3.76%, against 0.34%. The 30-year French OAT yields 4.74%, against 0.88%.
Read those five numbers together. This is not an American story, and it is not a policy story. Policy rates have in fact been coming down: the Fed is at 3.63%, the ECB at 2.40%, the Bank of England at 3.75%. The long end has risen anyway. When short rates fall and long rates rise, the market is not making a statement about the next meeting. It is repricing term premium, which is the compensation demanded for holding sovereign duration through an uncertain fiscal future.
That is the signal worth taking seriously. The bond market has spent forty years subsidising sovereign borrowers and has now, across four currency blocs simultaneously, begun charging them instead. For a government whose interest bill is already compounding, a rising long end is not a market condition. It is the trap tightening.

V. The Trap Closes on the Majors
The United States gets the attention because it issues the reserve currency, but the arithmetic is not uniquely American, and in several places it is worse.
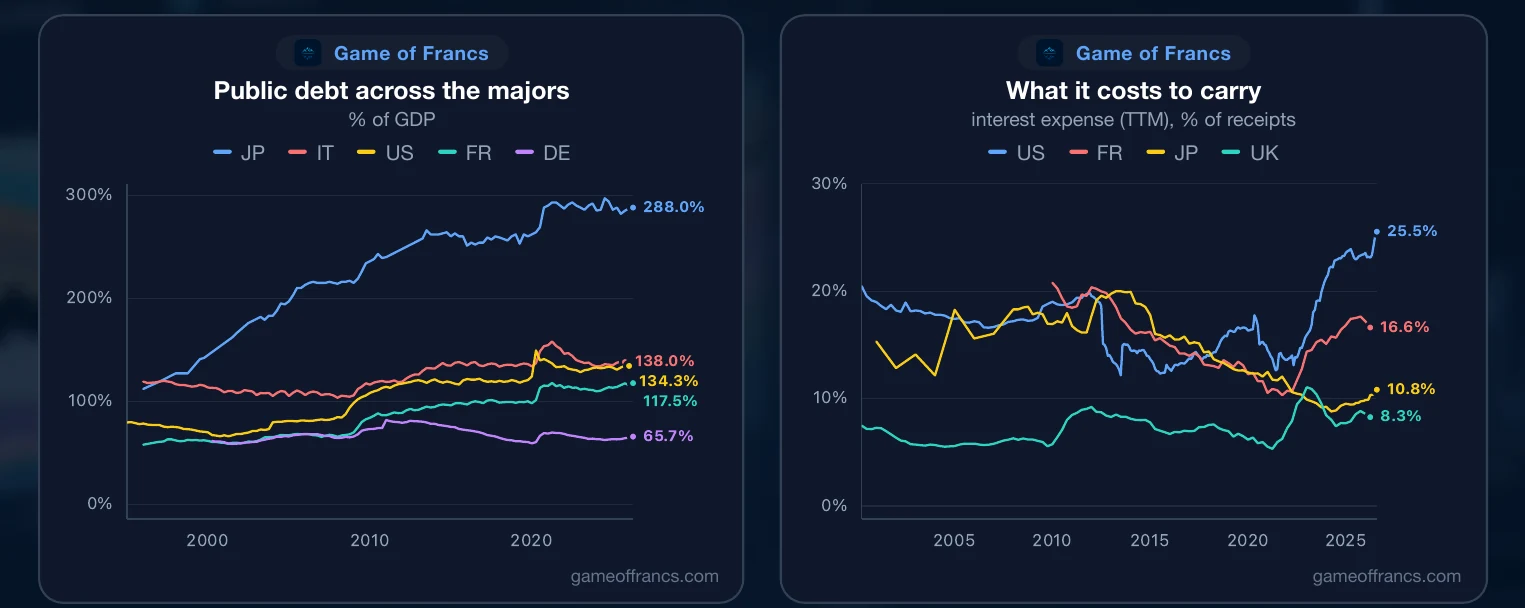
France carries public debt of 117.5% of GDP as of the first quarter of 2026, up from 98.0% at the end of 2019, with a deficit still running at 4.1% and interest already absorbing 16.6% of central government receipts, against 12.2% at the end of 2019. That combination, a rising stock, an unclosed deficit, and a climbing servicing cost, in a country that cannot devalue and does not set its own policy rate, is the tightest version of the trap in the developed world.
Japan is the extreme on the stock and the mildest on the flow, for now. Public debt reached 288% of GDP in the first quarter of 2026, up from 262% at the end of 2019, and yet interest absorbs only 10.8% of receipts, down from 12.4% in 2019. That is the reward for decades of near-zero rates. It is also the vulnerability, because the policy rate has now lifted to 0.98% and the 30-year JGB has quadrupled its yield from the 2019 level. Japan is the cleanest natural experiment running: the largest debt stock in the developed world, meeting a normalising interest rate for the first time in thirty years.
The United Kingdom sits in between, with interest at 8.25% of receipts but the highest long-end yield of any major, at 5.85%. Italy carries public debt of 138.0% of GDP. Germany, at 65.7%, is the outlier with genuine fiscal space, which is precisely why it has become the swing factor in European rearmament.
The pattern across all of them is the same shape at different stages. Debt stocks that rose during the pandemic and never came back down, deficits that persist through expansions, and a servicing cost that has begun to compound from a low base. What varies is the timing, not the direction.

VI. Guns Enter the Budget
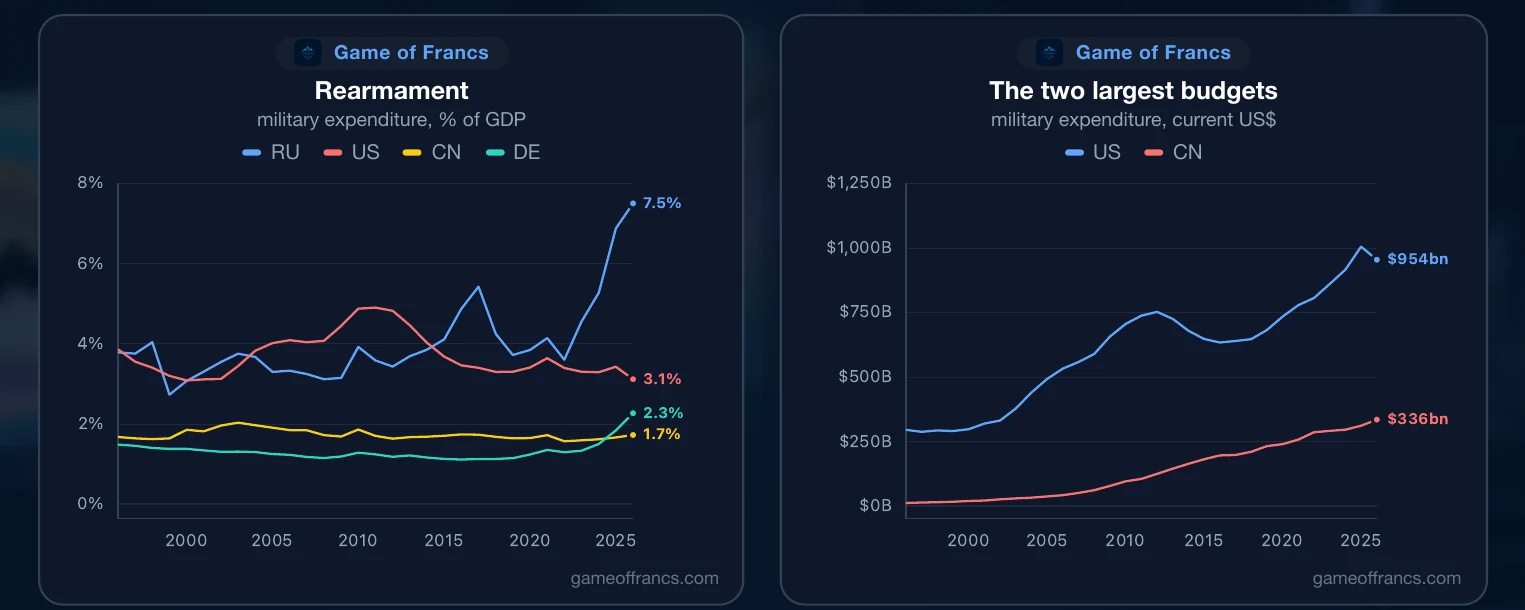
Into that arithmetic arrives the least discretionary spending category of all. World military expenditure reached $2.887 trillion in 2025, a real increase of 2.9% and the eleventh consecutive annual rise, taking the global military burden to 2.5% of GDP, its highest since 2009, according to SIPRI. Europe was the engine, with spending up 14% to $864 billion, the fastest annual increase among NATO's European members since 1953.
The country-level moves are what matter for the fiscal picture. Germany's military spending reached 2.27% of GDP in 2025, against 1.24% in 2019, crossing 2% for the first time since 1990, with a stated path toward 3.5% by 2029. Russia's reached 7.50% of GDP, against 3.85% in 2019, close to a doubling of the share of its economy devoted to the military. China's spending reached $335.5 billion, up from $240.3 billion in 2019. And NATO members agreed in 2025 to a new target of 5% of GDP by 2035, replacing the 2% benchmark that most of them spent a decade failing to meet.
The macro consequence is not primarily about who wins anything. It is that rearmament is a permanent, politically protected claim on budgets that were already unbalanced, arriving precisely when the interest line is compounding. Defence spending is famously easy to start and famously hard to stop. A government facing both a rising interest bill and a rising defence floor has lost most of the discretion it might have used to stabilise the debt.
This is why the cycle framework treats external conflict and fiscal deterioration as the same phenomenon rather than two. Conflict is expensive; expense is financed by borrowing; borrowing at a rising cost of capital accelerates the very fiscal stress that makes societies more inward-looking and more willing to fight. The loop is old and well documented, and it is running now on every continent that matters.

VII. What "Late Stage" Actually Means
Put the pieces together and you have the configuration the long debt cycle framework calls the late stage. It is worth being precise about what that claim does and does not assert, because the phrase is used loosely enough to have lost most of its meaning.
Late stage does not mean imminent crisis. It means the exits have narrowed. A government carrying heavy debt at a rising cost of capital has exactly four ways out, and only four. It can grow faster than the interest rate, which requires a genuine productivity leap. It can run primary surpluses, which requires austerity that democracies rarely sustain. It can default, which reserve issuers do not do. Or it can inflate, allowing nominal GDP to grow faster than the real burden while the cost falls on creditors and savers rather than on any identifiable voter.
Ranked by political difficulty, that list has an obvious answer, and history is close to unanimous about which one gets chosen. Sustained inflation is not a policy anyone announces. It is what happens when the other three exits are closed and the fourth is left open by default. This is why the framework treats the late stage of a debt cycle and the erosion of a currency's purchasing power as the same event observed at different speeds.
The tell that a system has entered this phase is not a single indicator but a configuration: debt above 100% of GDP, an interest bill that has overtaken major discretionary categories, deficits that persist at full employment, a long end that is repricing against the sovereign, a rearmament cycle claiming what discretion remains, and reserve managers quietly hedging the system they administer. Every one of those conditions is now measurable, and every one of them is present. That last item is where the money has already voted.
VIII. Gold Reprices
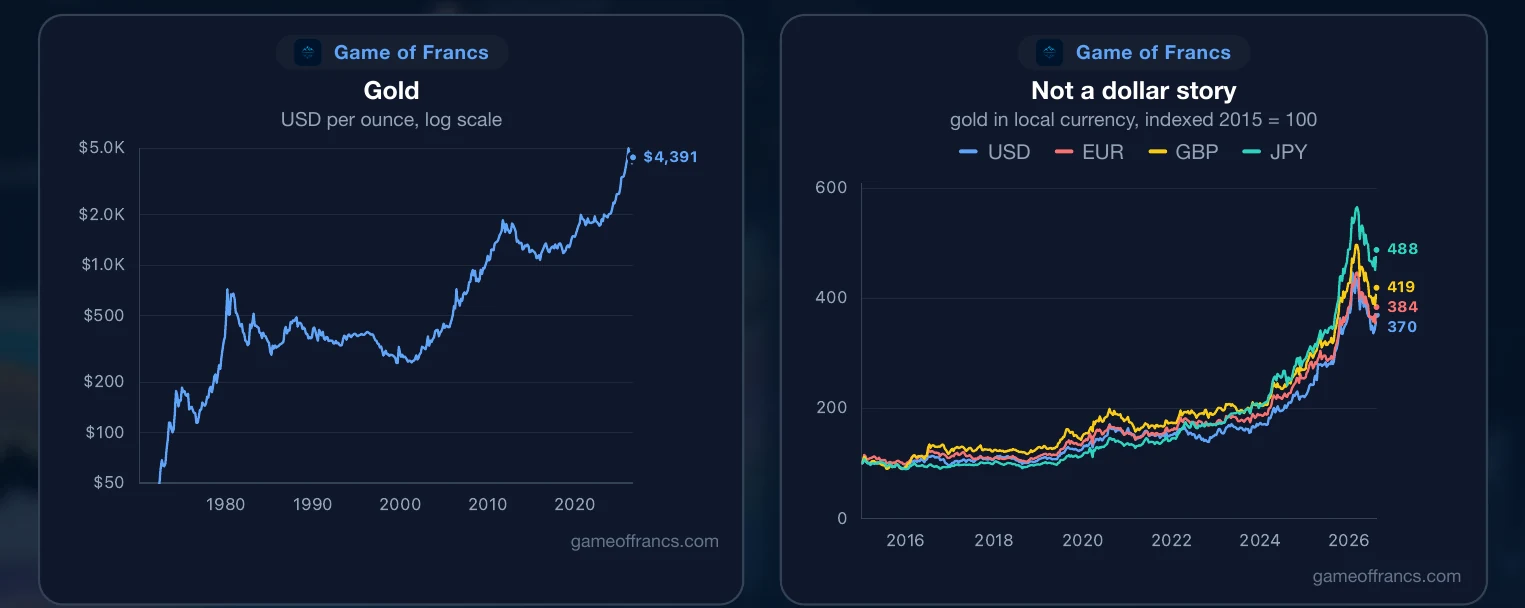
Gold traded at $4,427 an ounce on 12 August 2026. At the end of 2015 it was $1,163, at the end of 2019 it was $1,390, and at the end of 1999 it was $279.91. That is a rise of 3.8 times in a decade and roughly 15.8 times since the turn of the century, in a period during which the world was repeatedly told that inflation was dead and that a non-yielding asset had no place in a modern portfolio.
The path is not a straight line, and it is worth saying so plainly. Gold peaked at $5,405 in January 2026 and has given back about 18% since. A repricing of this magnitude has never proceeded without violent corrections, and the drawdown is neither evidence that the thesis is broken nor a reason to expect the next leg. It is what a re-rating of a monetary asset looks like from the inside.
The conventional explanations do not survive contact with the data. Gold is often described as an inflation hedge, but the largest part of this move came after headline inflation had already rolled over. It is described as a real rate trade, but real yields have risen substantially over the same period, which under the standard model should have crushed it. It is described as a fear trade, but equity indices have not behaved like an asset class in flight.
What fits better is simpler. Gold is the only major reserve asset that is not simultaneously somebody's liability. In a world where the largest sovereign borrowers are visibly struggling with the arithmetic of their own debt, where sanctions have demonstrated that reserves held in another country's financial system can be frozen, and where the long end is repricing the credit of governments rather than just the path of policy, an asset with no counterparty acquires a premium that no discounted cash flow model will capture.
That is a repricing of trust, not of inflation expectations. And the clearest evidence that this is the correct reading is not what private investors have done. It is what the official sector has done.
IX. Gold Returns to the Reserve Stack
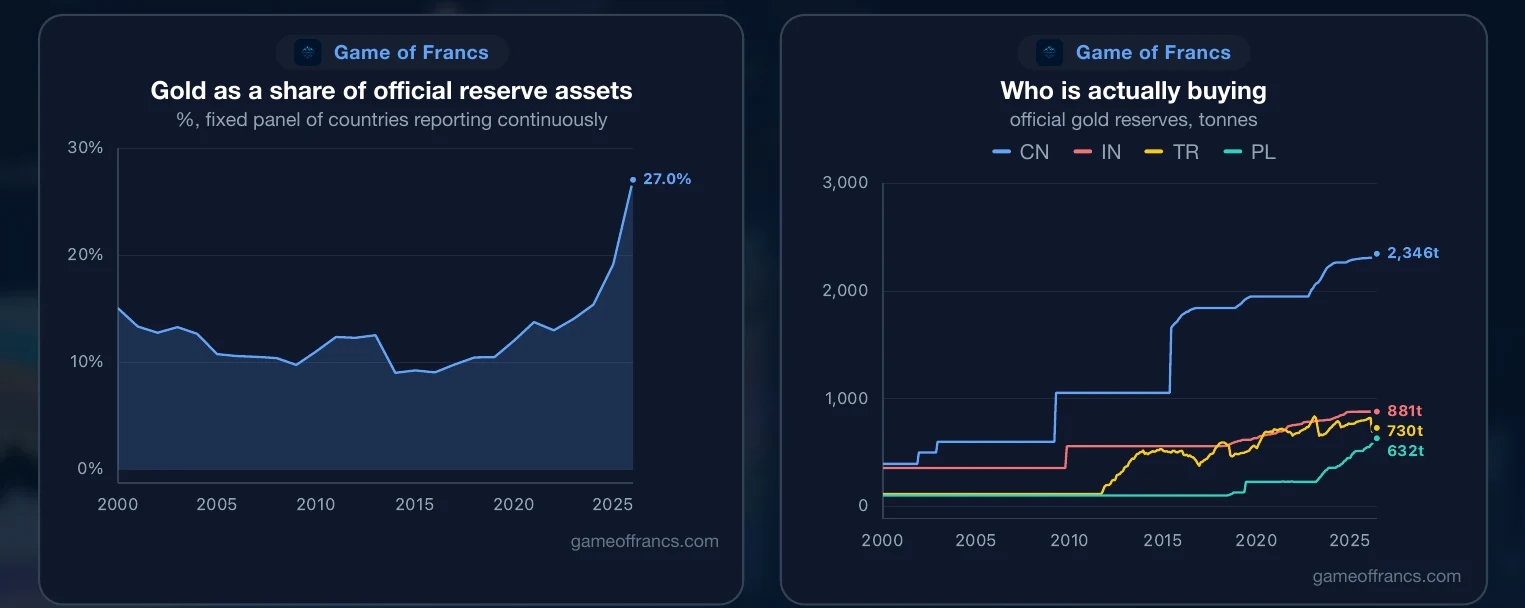
Across a fixed panel of 124 countries reporting continuously, gold accounted for 27.0% of total official reserve assets at the end of 2025. At the end of 2024 the figure was 19.1%, at the end of 2019 it was 12.0%, and at the end of 2015 it was 9.1%. Gold has gone from a rounding error in the reserve stack to roughly a quarter of it inside a decade.
Honesty requires immediately qualifying that. The dollar value of official gold in that panel rose 4.4 times between 2015 and 2025, while the gold price itself rose 3.7 times. Divide one by the other and the tonnage contribution is about 20%. The overwhelming majority of the rise in gold's share is the price, not new buying. Anyone presenting the 27% figure as evidence of a stampede into bullion is misreading their own chart.
But the tonnage moves are real, and they are concentrated. China's holdings rose from 1,762 tonnes at the end of 2015 to 2,346 tonnes in June 2026. Poland went from 103 tonnes to 632 tonnes over the same period, roughly a sixfold increase, in pursuit of a stated 700-tonne target driven by security concerns on NATO's eastern flank. India moved from 558 tonnes to 881. The United States, meanwhile, has held 8,133.5 tonnes essentially unchanged since the 1950s. The World Gold Council reports central banks added a net 289 tonnes in the second quarter of 2026, up 62% year on year and the strongest second quarter in its series, with 89% of surveyed reserve managers expecting global official holdings to keep rising. It is not universal: Turkey's holdings fell from 811 tonnes in December 2025 to 730 by June 2026, and Russia has also been a seller, both under domestic fiscal pressure rather than a change of view.
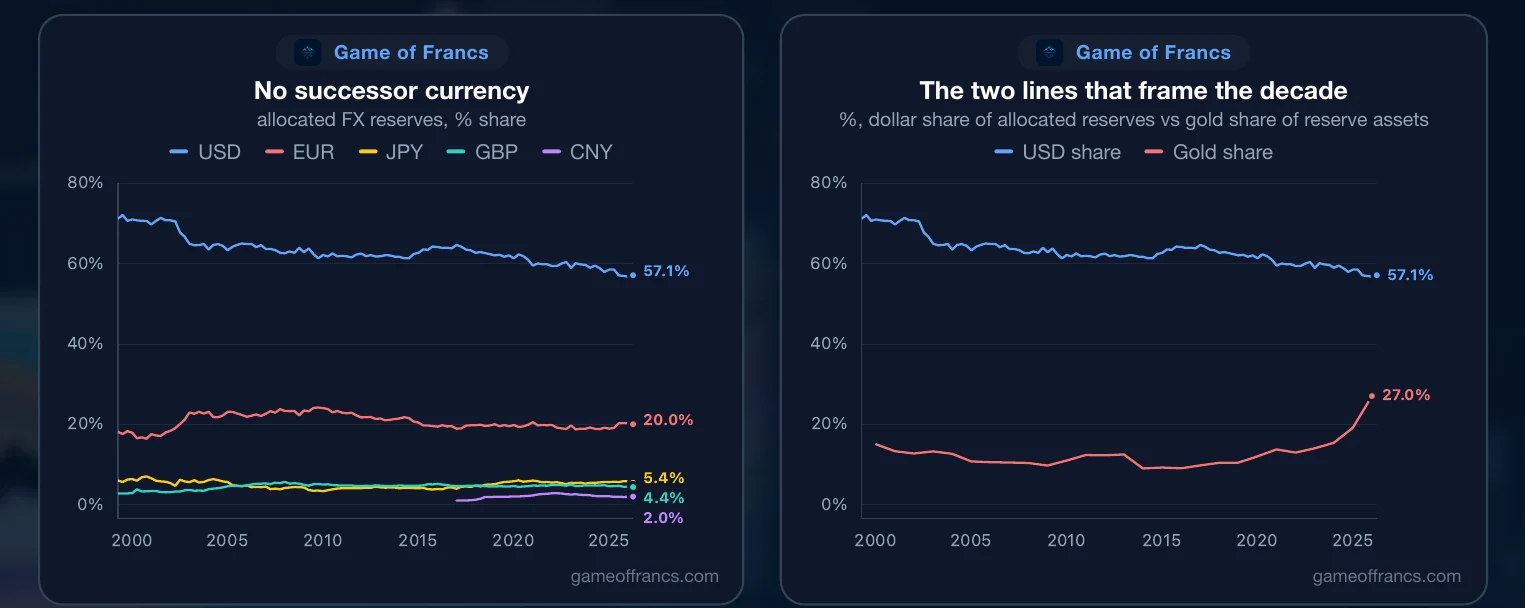
Set that against the currency side and the picture completes itself. The dollar's share of allocated reserves was 57.1% in the first quarter of 2026, against 71.0% at the end of 1999. But look at where the lost 14 points went. The euro gained about two points, to 20.0%. Sterling gained roughly one and a half. The renminbi sits at 1.99%, essentially unchanged from 2.03% at the end of 2019, despite a decade of speculation about its ascent. The largest gains went to the residual "other currencies" bucket, which rose from 1.6% to 6.2%, alongside the Canadian and Australian dollars. No successor is emerging. The reserve system is not rotating from one anchor to another; it is fragmenting into many small positions, plus gold, which the currency statistics do not even count.
 ChinaMoney
X. Conclusion: The Terrain, Not the Forecast
Nothing in the preceding pages is a prediction. The United States retains the deepest and most liquid capital markets in existence, an unmatched institutional premium, and no credible rival for the reserve role: the euro lacks unified fiscal backing, the renminbi lacks open capital markets, and gold cannot settle trade. Reserve status is the last thing to go, and heavy debt burdens can be carried for a very long time, as Japan has demonstrated for a quarter of a century.
What has changed is that the configuration is no longer hypothetical. Debt above 100% of GDP in most of the developed world. An American interest bill of $1.37 trillion, exceeding defence spending and absorbing a quarter of federal receipts, on a debt stock three times the size of the last comparable episode and with rates moving the wrong way. Thirty-year yields repricing across four currency blocs at once while policy rates fall. A rearmament cycle claiming the remaining fiscal discretion. And an official sector that has taken gold from 9% to 27% of its reserve assets while the dollar's reserve share fell to a modern low, with no successor currency absorbing the difference.
The honest position is not that a reckoning is scheduled. It is that the room for manoeuvre has narrowed to the point where the outcome depends on something the data cannot yet see: whether the current wave of automation delivers a productivity leap large enough to grow out of the arithmetic, or whether it merely concentrates the gains further and widens the internal fractures that late-cycle economies can least afford.
That is the genuinely open question of the decade. Everything else on this list has already moved, and it is all public, scattered across dozens of statistical agencies and central banks. Bringing it into one place, so the next data point arrives as a signal rather than a shock, is what this platform is for.
 WorldMoney
Get the next article by email
One email when a new piece is published. Nothing else, and one-click unsubscribe from any message.