
#12 - The Return of Gold
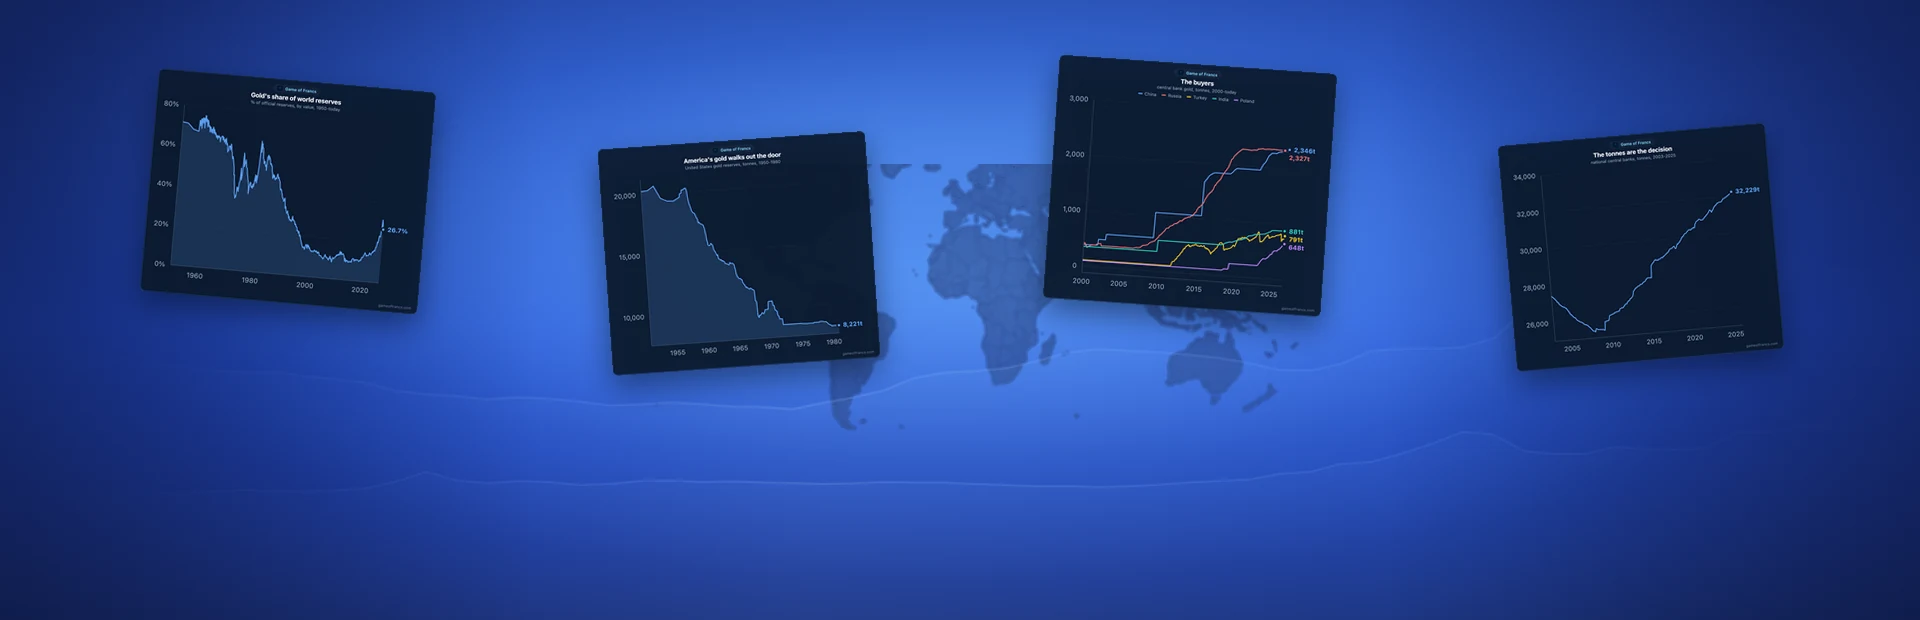
In 1950, seven of every ten dollars the world's central banks held in reserve were held in gold. By 2008 it was fewer than one in ten. At the end of 2025 it was more than one in four. Read together, their monthly reserve reports describe the institutions that issue the world's money quietly moving their own savings out of promises and into the one reserve asset that is nobody's liability.
by Game Of Francs Research Team
 WorldMoney
I. The Vault Report
Every month, the world's central banks report what they hold. Most of it is foreign currency — deposits at other countries' banks, bonds issued by other countries' governments. A smaller part is gold. The report is dry, technical and almost never read, and over the last seventeen years it has recorded one of the most consequential changes in the monetary system since the end of the gold standard.
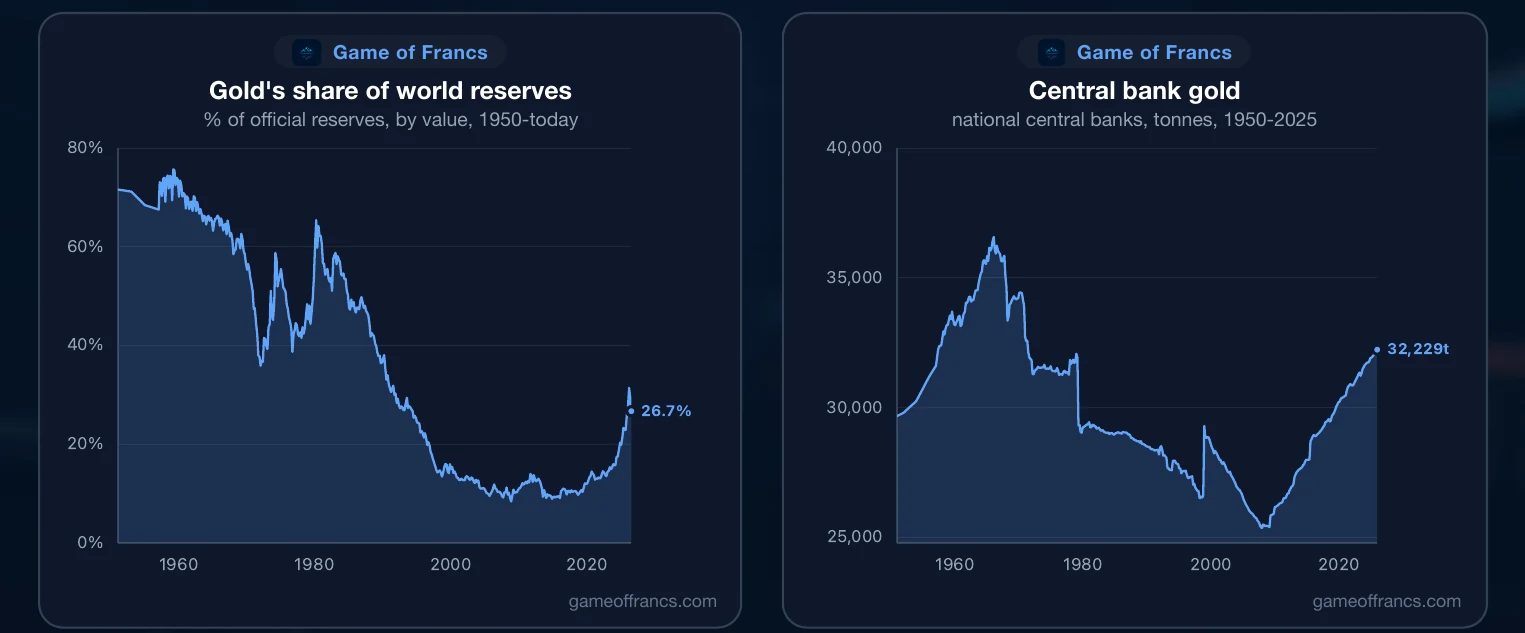
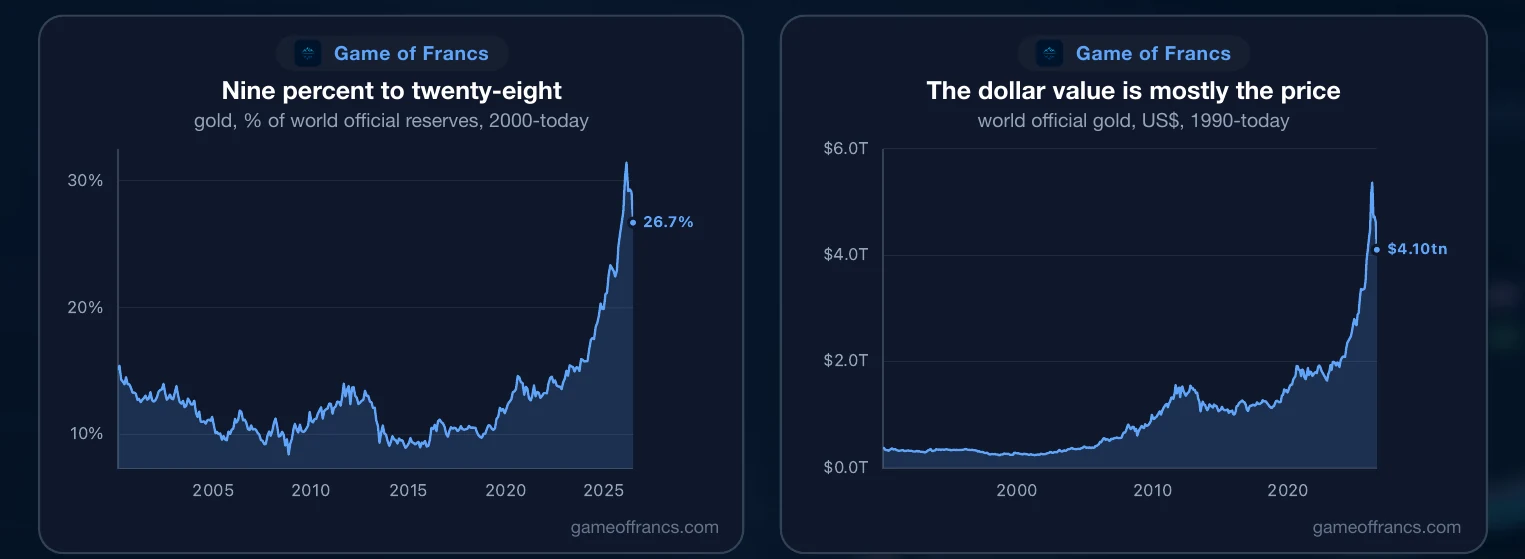
Measured by value, gold was 72% of the world's official reserves in 1950. By the end of 2008 it was under 10%, and in October of that year it touched 8.4%, the lowest in the record. At the end of 2025 it was 27.6%. Part of that climb is the price of gold, which has risen enormously; part of it is not. The distinction between the two — the price of the metal and the quantity of it — is the thread that runs through everything that follows.
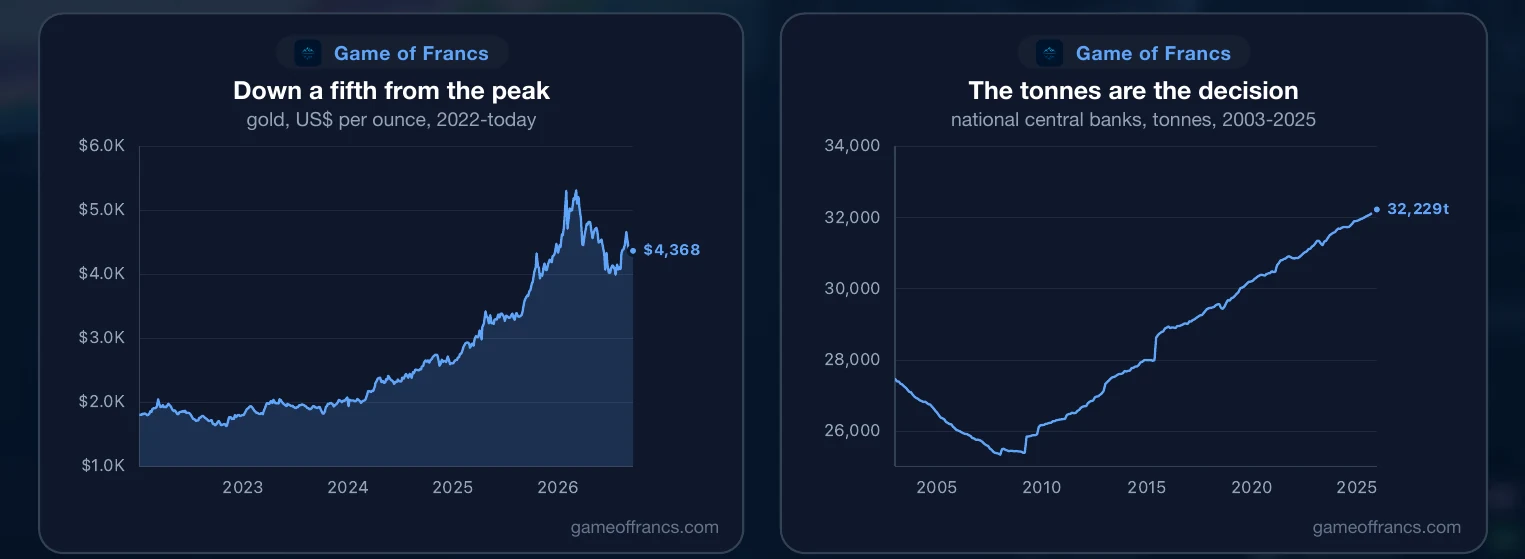
The dollar value of the gold held by central banks reached more than $5 trillion in early 2026, and stood near $4.1 trillion in June. That number is spectacular and, on its own, says little: most of its rise is the market price. The tonnage says something else. It records what central banks decided to do, and it has risen every single year since 2008.
 WorldMoney
II. What a Reserve Is for
A central bank keeps reserves for the moment when everything else fails. It spends them to defend its currency when capital runs, to pay for imports when export earnings collapse, and — the least visible and most important use — to prove to the rest of the world, every day, that its money is backed by something it could hand over.
For fifty years that stock has consisted mostly of other people's money. The world's central banks now hold some $11 trillion in foreign currency. A dollar bond is a claim on the American Treasury. A euro deposit is a claim on a European bank. Such assets are convenient: they pay interest, they trade in deep markets, they can be moved in seconds. But every one of them is a promise, and a promise is worth exactly what its issuer decides to honour — in full, in part, late, or in a currency whose value the issuer itself controls.
Gold is the one reserve asset that is nobody's promise. It pays nothing. It is heavy, expensive to store and awkward to move. And it cannot be frozen, printed or defaulted on by anyone except the institution that holds it. For a private saver that distinction is abstract. For a central bank, whose reserves exist precisely for the day when promises are broken, it is the whole point.
III. When Gold Was the System
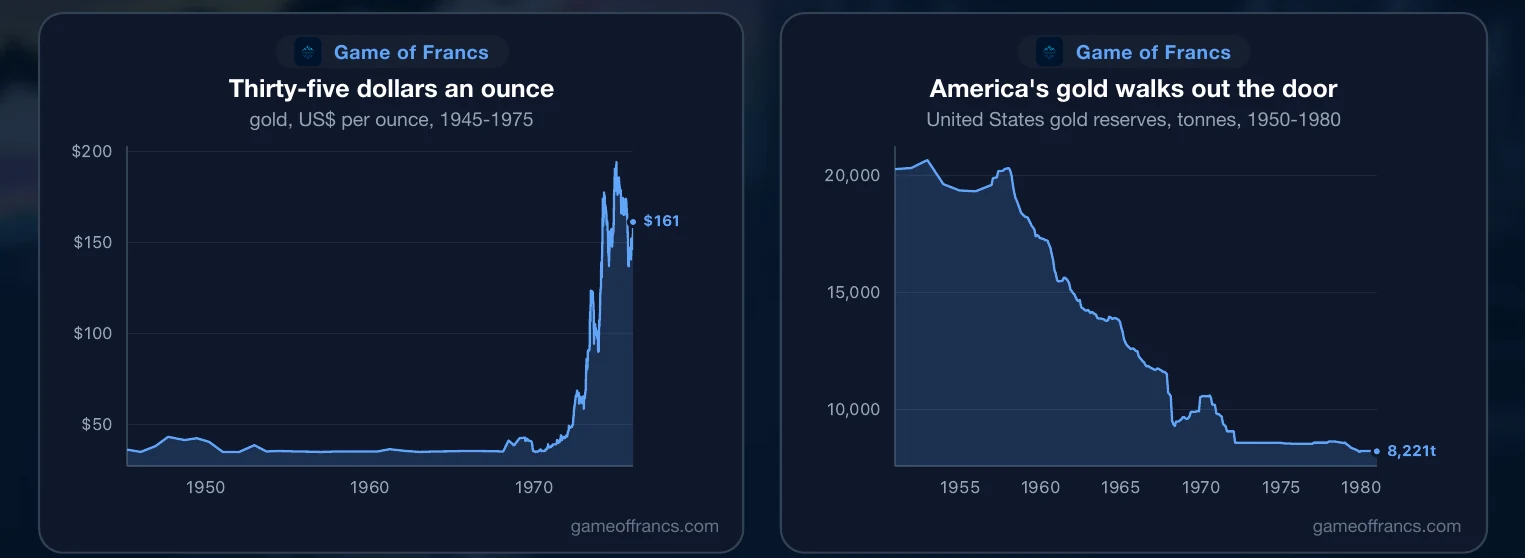
For most of the twentieth century the distinction did not need explaining, because gold was the system. Under the arrangement that followed the Second World War, the dollar was fixed at thirty-five dollars an ounce, and foreign central banks could turn their dollars into American gold at that price. Every other currency was pegged to the dollar. Gold sat at the bottom of the whole structure, and the dollar was its warehouse receipt.
Foreign central banks used the right. In 1952 the United States held more than 20,600 tonnes of gold — the largest hoard any nation has ever accumulated. By the end of 1971 it held 9,070 tonnes, and by 1972 under 8,600. More than half of America's gold left the country in twenty years, one conversion at a time, because the rest of the world preferred the metal to the promise.
The arithmetic was not mysterious. The United States issued more dollars than it had gold to back at thirty-five dollars an ounce, and the holders of those dollars noticed. The market price of gold in London began to drift above the official price at the end of the 1960s. Each conversion drained the vault further, and there was only one way the drain could end.

IV. 1971, and What Followed
In August 1971 the window was closed. Dollars could no longer be converted into gold at any price. From that moment every currency in the world became a promise backed by nothing but its issuer's word, and the price of gold was set free.
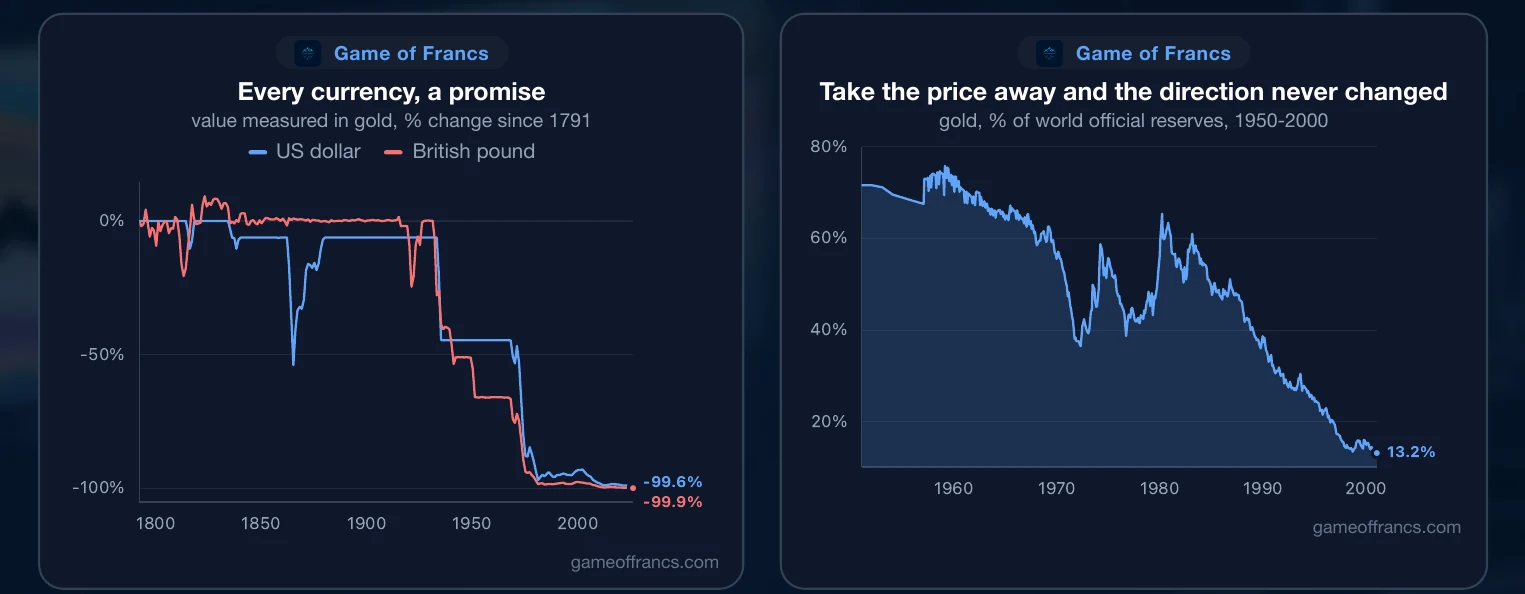
Measured in gold, the consequence is stark. The dollar had lost a little under half of its value against gold across its first 180 years, most of it in the devaluation of 1934. After 1971 it lost most of what remained within a decade. The pound followed the same curve from a lower starting point. Every paper currency does, once nothing anchors it: measured against a unit that cannot be issued at will, the history of fiat money is a single line running towards zero.
That shows in the composition of reserves. Gold was 72% of everything central banks held in 1950 and 36% by 1971. In 1980 its share jumped back to 60% — but not because anyone bought: the price of gold had multiplied nearly twentyfold in a decade of inflation, from $43 an ounce in August 1971 to more than $800 in January 1980. Take the price away and the direction never changed. The quantity of gold in official hands peaked in 1965, and by 2000 gold was 13% of world reserves.
 WorldSummary
V. The Great Selling
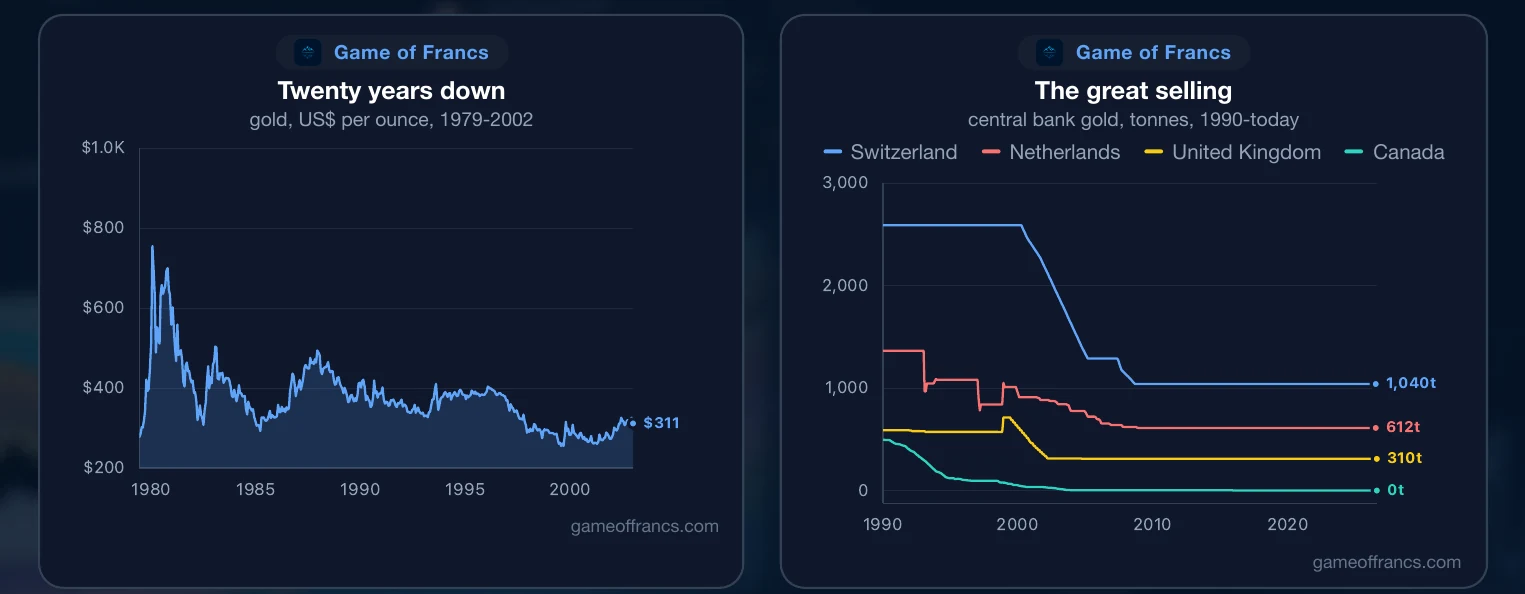
Then central banks sold. Through the 1980s and 1990s gold fell almost continuously, and in August 1999 it touched $252 an ounce, its lowest price in twenty years. The selling continued anyway.
Switzerland, whose currency had been among the last to carry a legal gold cover, held 2,590 tonnes in 2000. By 2009 it held 1,040 — it had sold three fifths of its gold. The United Kingdom sold more than half of its reserves between 1999 and 2002, near the bottom of the market, going from 715 tonnes to 310. The Netherlands, which held 1,082 tonnes in 1996, sold down to 612. Canada, which held more than a thousand tonnes in the mid-1960s, sold every ounce; its official gold holdings are now zero.
The reasoning was sound on its own terms. Gold paid no interest. Government bonds did. In a world where the major currencies were managed by independent central banks with inflation targets, holding a dead metal instead of a live promise looked like an expensive superstition, and the institutions selling were doing what the prevailing theory of money told them to do.

VI. The Bottom, and the Test
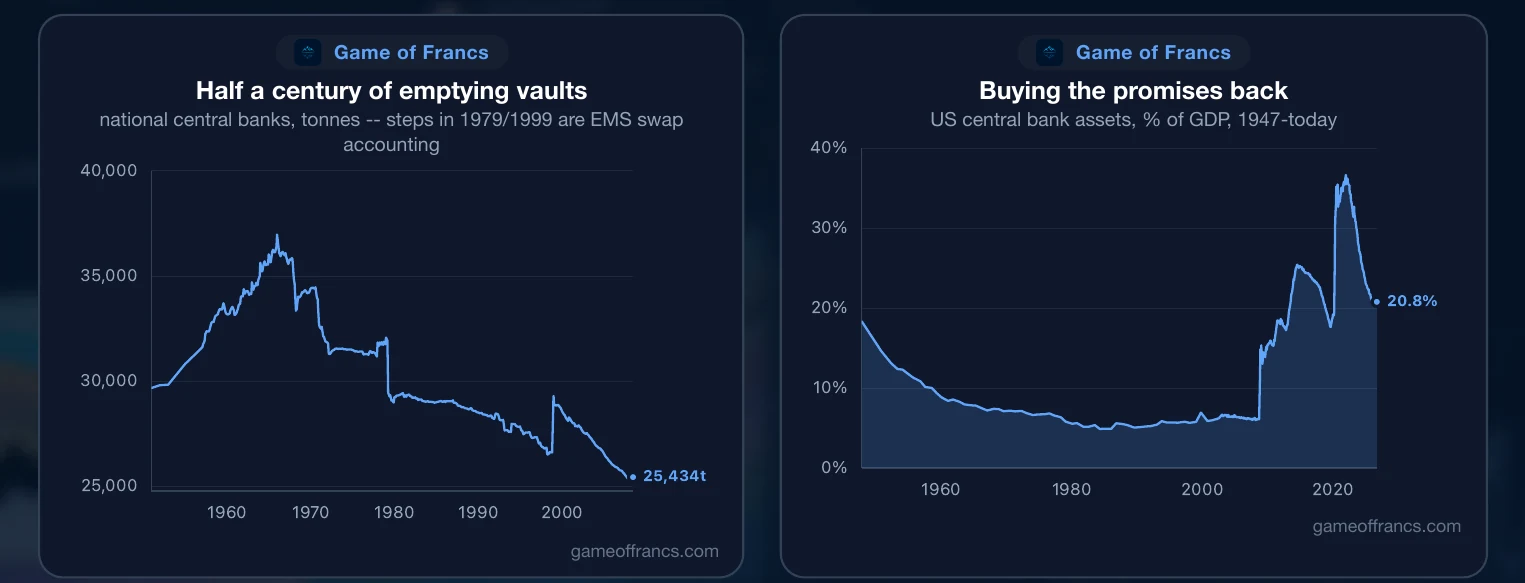
The gold held by the world's national central banks bottomed in January 2008, at 25,300 tonnes — down from almost 37,000 at the 1965 peak. The series has two visible steps along the way, in 1979 and 1999; neither is buying or selling. They are the accounting of the European gold swaps of the European Monetary System, and their unwinding when the euro was launched.
Months after the bottom, the promises were tested. The financial crisis of 2008 did not make any major government default. What it did was show how quickly the value of a promise can be diluted. Central banks cut interest rates to zero and bought their own governments' bonds on a scale last seen in the 1940s. The Federal Reserve's assets were worth 18% of American output in 1947, at the end of the war-financing era, and 6% in 2007. They reached 37% in 2021.
That is not an accident of one crisis. It is what happens at the end of every long debt cycle: when debts grow too large to be serviced at any interest rate the economy can bear, the central bank buys them, and the currency those debts are written in absorbs the difference. The interest that had made reserve bonds worth holding disappeared, and with it the argument for selling gold.
VII. From Sellers to Buyers
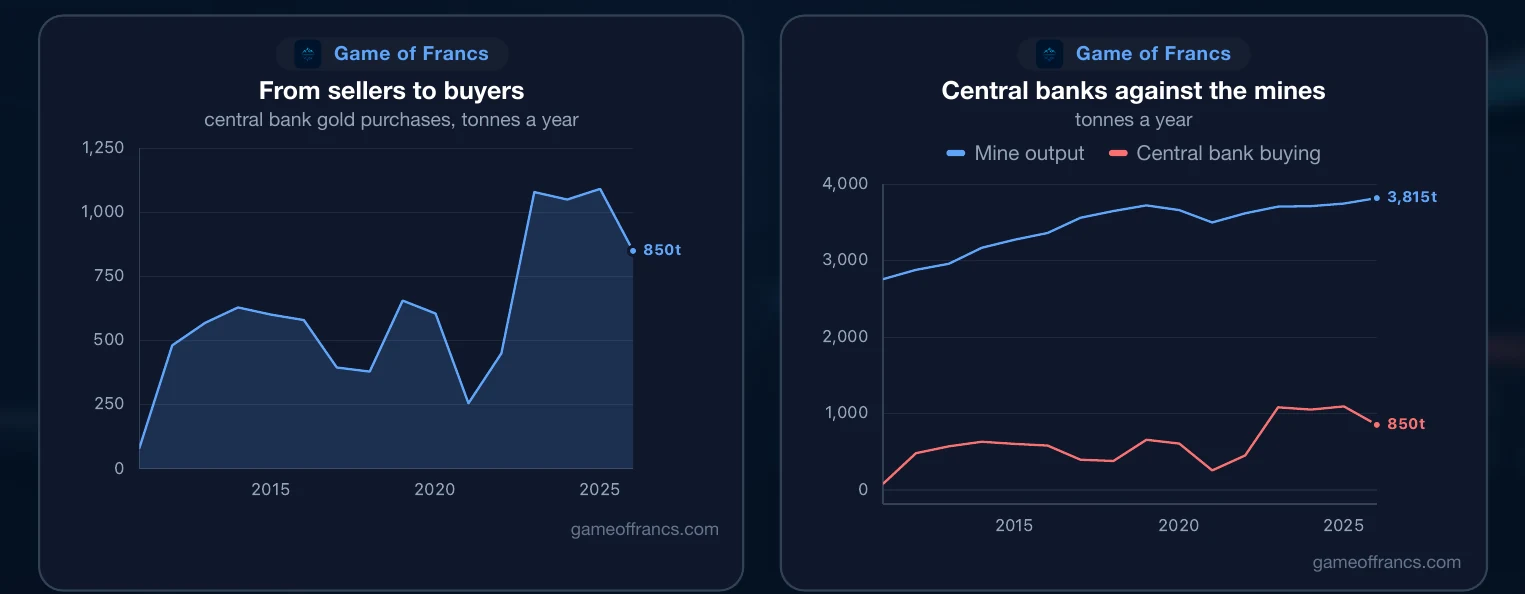
So central banks stopped selling, and started buying. The turn came around 2010. Through the 2010s they bought a little over five hundred tonnes a year.
In 2022 the number doubled. Central banks bought more than a thousand tonnes of gold that year, again in 2023, and again in 2024. In 2024 their purchases equalled nearly thirty percent of all the gold the world's mines produced. In 2025 buying eased to 850 tonnes — still more than in any year before 2022.
Something happened in 2022 to explain that jump, and it was not the price.
VIII. The Reserve That Was Switched Off
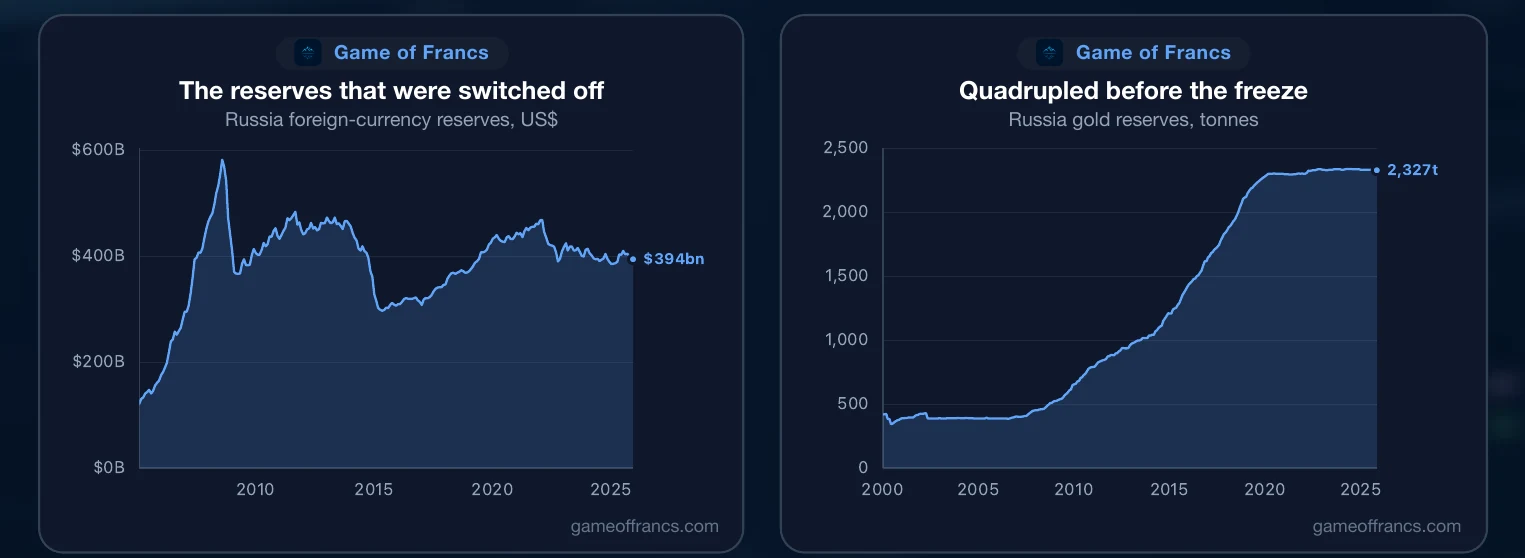
In February 2022, the reserves Russia's central bank held in Western currencies were frozen: hundreds of billions of dollars of foreign assets, reported on Russia's balance sheet and instantly unusable. Russia's foreign-currency reserves stood at $468 billion at the end of 2021. On paper, they still exist.
Every central bank in the world drew the same lesson. A reserve held as a claim on another country's financial system is a reserve that the other country can switch off. It does not matter whether the decision is just; what matters is that it can be made, by someone else, at the moment the reserve is needed. Gold held in your own vault cannot be switched off by anyone.
Russia had been buying for years. It bought steadily from 2008 to 2020, quadrupling its holdings from 520 tonnes to about 2,300. By the time its foreign currency was frozen, gold was the part of its reserves that could not be touched — worth more than 11% of Russian output in 2026, against under 8% at the end of 2021.

IX. Who Is Buying
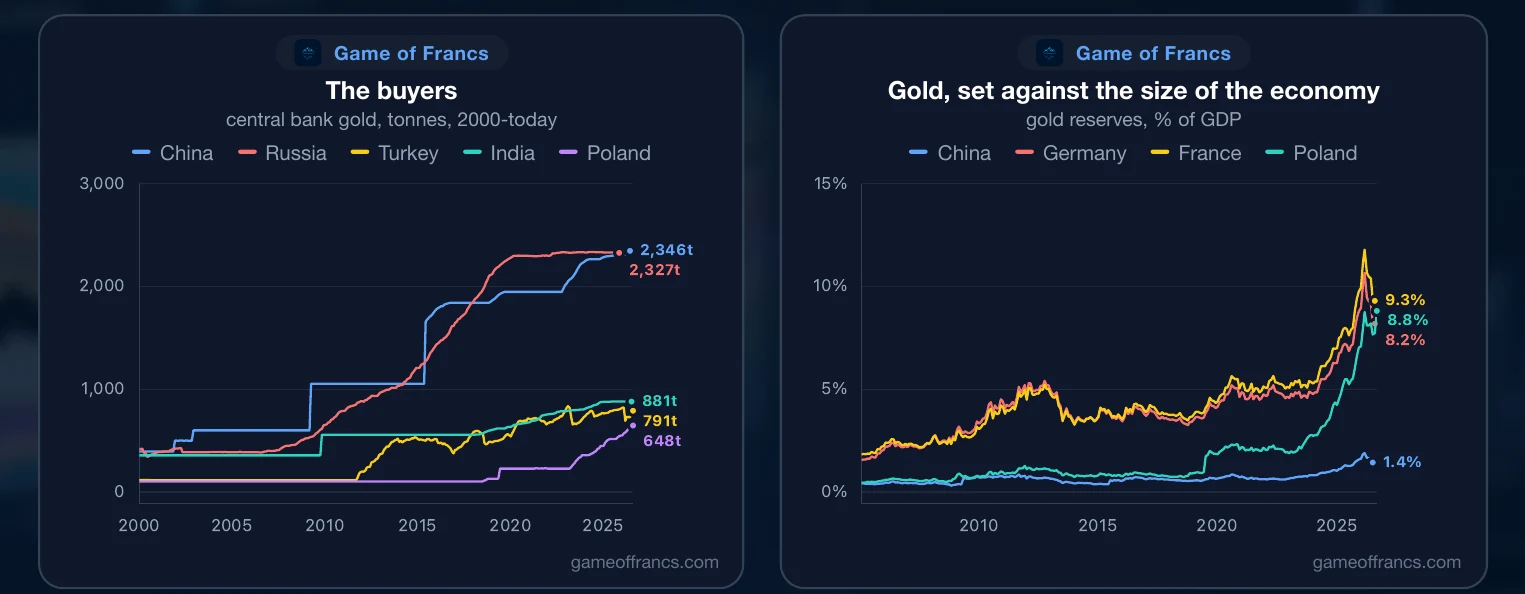
Since 2008, Russia has added some 1,800 tonnes of gold. China has added about 1,700. Turkey, close to 700. India, more than 500. Poland, about 450. Those five countries alone account for roughly three quarters of all the gold the world's central banks have added since the bottom.
China's buying has been slower to show and larger than it looks. It held 600 tonnes in 2008 and over 2,300 in mid-2026, adding in large announced steps rather than steadily. Yet set against the size of the Chinese economy, that gold is still worth less than two percent of output. Germany and France hold gold worth eight to nine percent of theirs. For China to match them, it would need about six times the gold it holds today.
The most striking case is not a rival of the West at all. Poland held the same 103 tonnes of gold for twenty years. Since 2018 it has multiplied that more than sixfold, to 648 tonnes, and it has kept buying through 2026; its gold is now worth close to nine percent of its entire economy. Next door, the Czech central bank held 11 tonnes in 2021. It holds 86 today. Qatar went from 12 tonnes in 2008 to 116.
These are not countries preparing to leave the Western financial system. They are members of it — two of them inside the European Union. The move into gold is not a bloc forming against the dollar. It is a broad, quiet reassessment of what a reserve is for.

X. The Dollar, Diluted
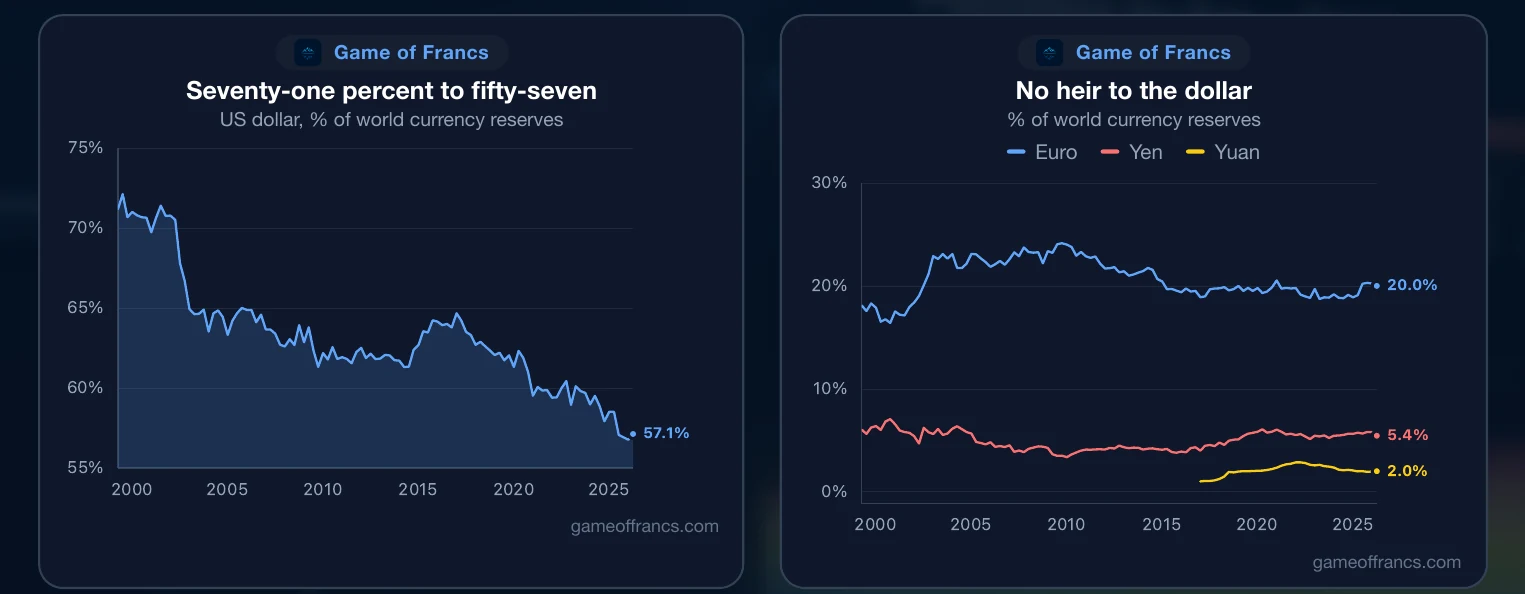
In 1999, 71% of the world's identified currency reserves were held in dollars. Today it is 57%, a whisker above the lowest share in the record, set at the end of 2025.
But look at where the share went. Not to the Chinese yuan, which peaked at under three percent of reserves in 2021 and has fallen back to two. The euro gained two points. The yen and the pound moved little. The largest gain went to a scatter of smaller currencies — and, above all, to gold, which sits outside the currency figures entirely.
The dollar is not being replaced by another currency. It is being diluted by the absence of one. Central banks are not choosing a new promise. They are choosing to rely less on promises.
XI. The Price and the Tonnes
None of this means gold only goes up. Gold ran from $1,800 at the end of 2022 to a peak of $5,405 on 29 January 2026, and in mid-September it traded near $4,300 — a fall of a fifth. The dollar value of the world's official gold fell with it, and gold's share of reserves slipped back from 31% in February to 27% in June.
That is why the tonnes matter more than the dollars. The dollar value of the world's gold reserves is mostly a statement about the market price. The tonnage is a statement about decisions. And the tonnage has risen every single year since 2008 — from 25,300 tonnes at the bottom to 32,200 at the end of 2025. It is still below the 1965 peak, and it is moving steadily towards it. Not every month is up — world holdings dipped in the spring of 2026 — but the annual direction has not changed in seventeen years.
XII. The Money Nobody Can Print
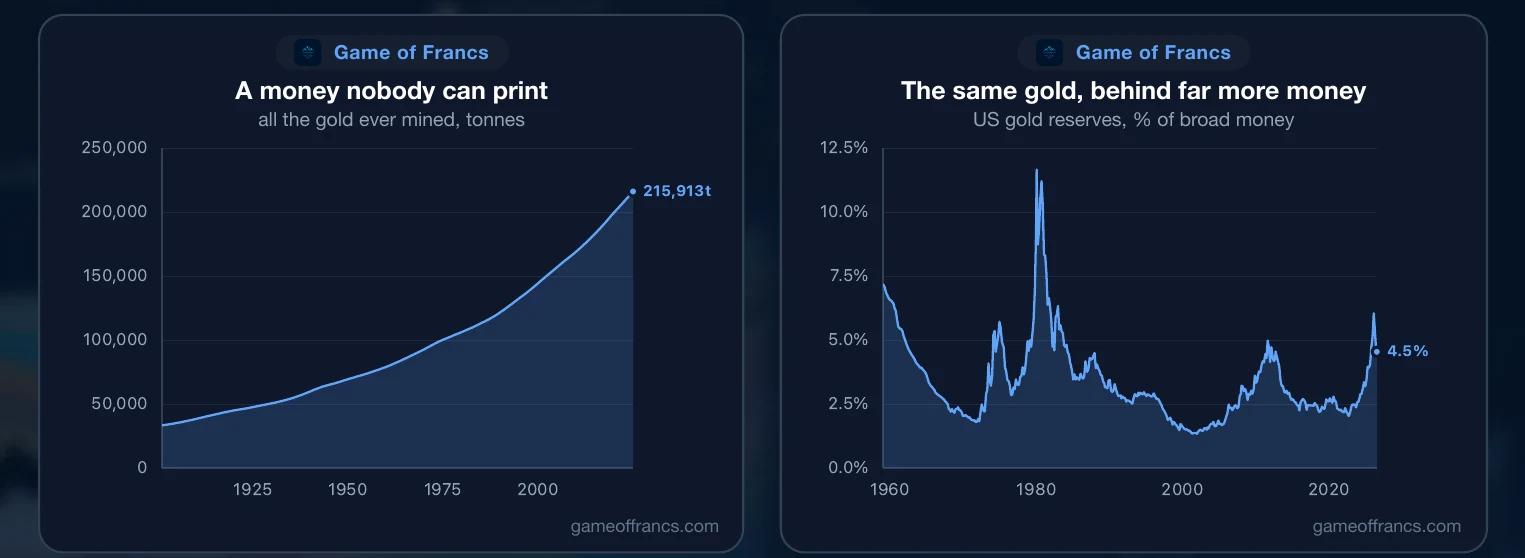
There is a reason gold behaves this way as money, and it is the reason it was chosen in the first place. All the gold ever mined amounts to about 216,000 tonnes, and the stock grows by about one and a half percent a year. It cannot be expanded by a vote, a bailout or a spreadsheet. Every currency that competes with it can be. Roughly one ounce in seven of all the gold ever mined now sits in a central bank.
In 1980, America's gold was worth nearly twelve percent of its broad money supply. By 2001 it was barely more than one percent. Today it is four and a half. America's gold has not changed by a single meaningful tonne in that time; the money it stands behind has multiplied, and the price of gold is how the two are reconciled. In the euro area, gold's backing of the money supply has more than quadrupled since 2005 for the same reason.
What should a saver take from this? Not that everyone should buy gold, and not that the dollar is finished — it is not. But the institutions that know the monetary system best, the ones that issue the money, have spent sixteen years moving their own savings out of promises and into something that is nobody's liability. When the people who issue the currency start saving in something else, it is worth asking why.
Get the next article by email
One email when a new piece is published. Nothing else, and one-click unsubscribe from any message.