
#14 - The Inequality Headline Everyone Gets Wrong
Every few months the same headline comes back: the richest one percent now own a bigger share of everything than ever. It is almost always read as a story about taking, in which someone at the top took more and someone at the bottom got less. Look at how that share actually moves and a different story appears. For forty years, the record was set less by what the rich were paid than by the price of what they already owned, and that price was set by the price of money.
by Game Of Francs Research Team
 United StatesInterest Rates
I. The Headline
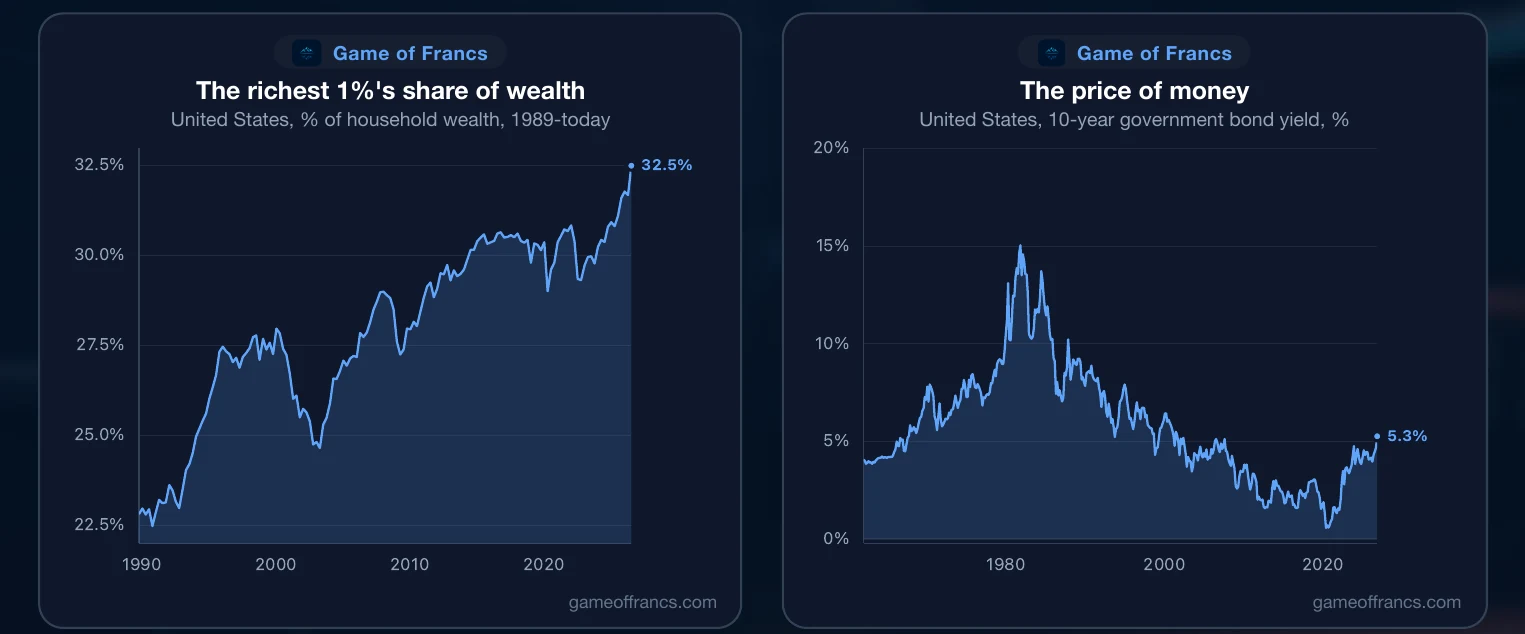
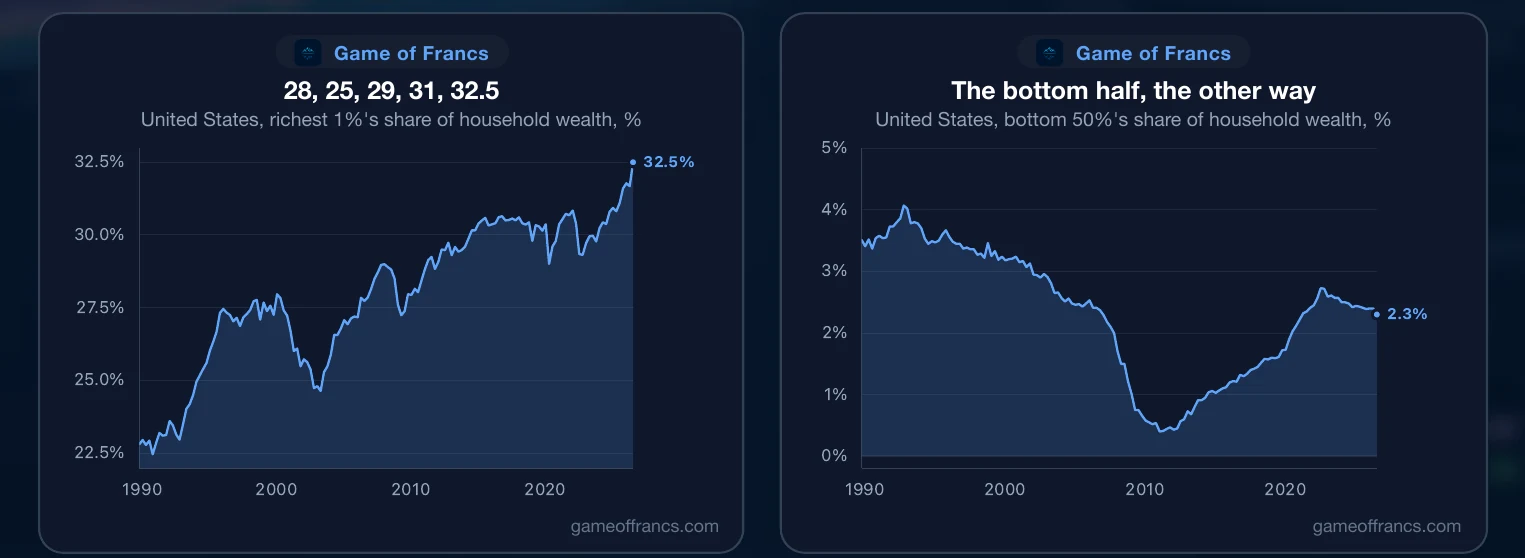
In America, the richest one percent of households owned 22.8% of the country's wealth in 1989. At the end of 1999 they owned 28%. Three years later, 24.8%. By the end of 2007, 29% again. Then down in the crash, to 27.2% in the first quarter of 2009, and up through the 2010s to 30.8% at the end of 2021. Down in 2022, to 29.3%. And 32.5% today, the highest on record.
The bottom half of households moved the other way, and far more violently. It held 3.5% of the country's wealth in 1989, and 0.4% at the end of 2010, after the crash had taken its houses. Today it holds 2.3%.
Those are the numbers behind the headline, and they are real. The question is what they measure. The top share lost more than three points between 1999 and 2002, and gained four back in the five years after. Nobody's pay moves like that. Something else does.
II. A Share Is a Price
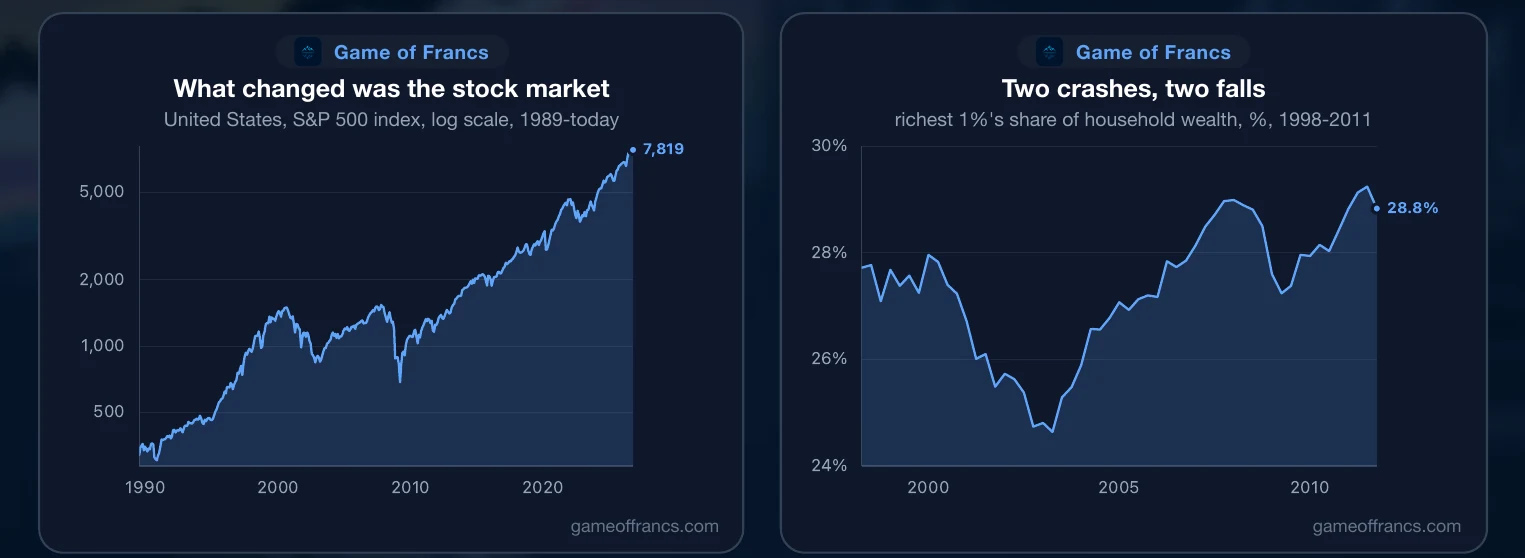
What changed each time was the stock market. Every time shares fell, the top one percent's share of the country's wealth fell with them. Every time they rose, it rose.
This is not a loose resemblance. Since 1989 there have been 147 quarters. In four of every five, the top share and the stock market moved in the same direction. And in every one of the 19 quarters in which shares fell by more than 5%, the top share fell too. Not most of them. All of them.
The reason is simple once it is said aloud. A wealth share is not a salary. It is a valuation: what the top owns, priced at today's prices, divided by what everyone owns, priced the same way. When the things the rich own go up in price faster than the things everyone else owns, their share rises, whether or not anyone has been paid a cent more. So the real question is not who took what. It is what moves the price of what the rich own. And the answer, for forty years, has been the price of money.
 United StatesEquity Prices
III. The Price of Money
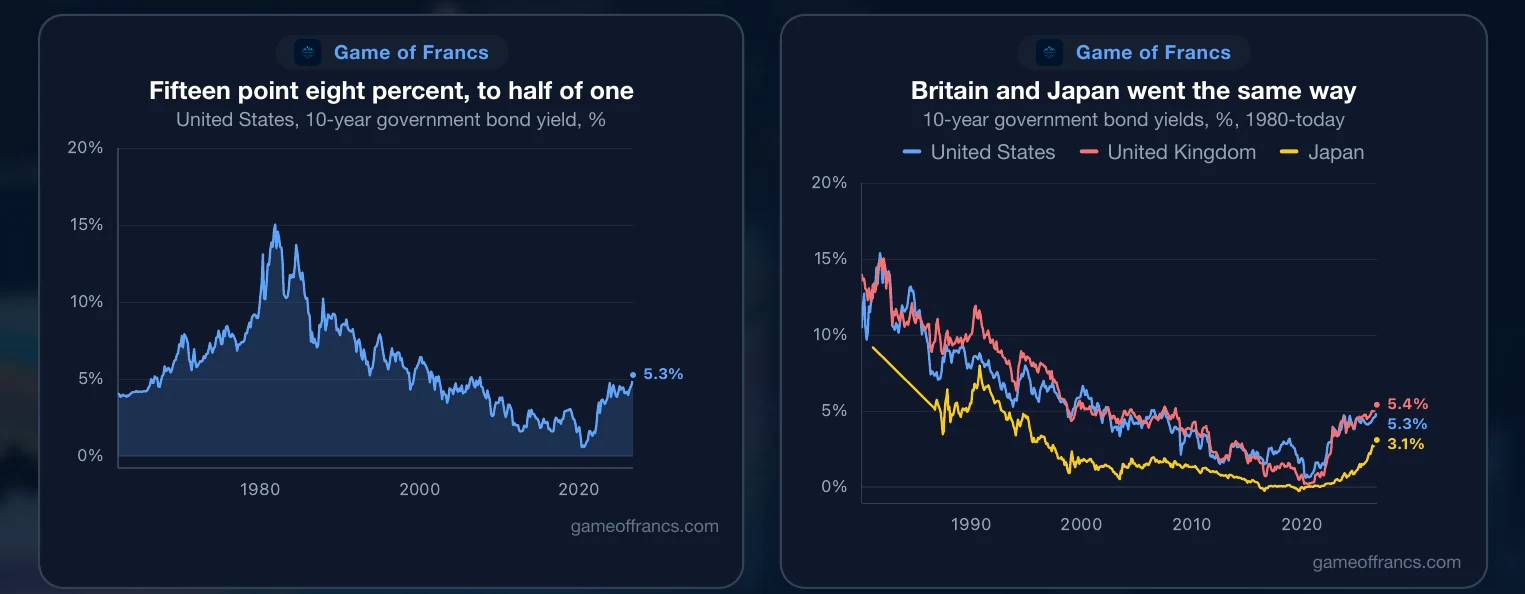
In September 1981 the United States government paid 15.84% to borrow for ten years. In August 2020 it paid 0.52%. Almost four decades of an interest rate falling, with interruptions, from one extreme to the other.
America was not alone. Britain paid 15.56% in 1981 and 0.11% in August 2020. Japan went further: in February 2016 its ten-year rate went below zero, and by July it stood at minus 0.30%. Lenders were paying the Japanese government for the privilege of holding its debt.
Most people experience a falling rate as a cheaper mortgage. Its much larger effect is on the value of everything that already exists.
IV. The Arithmetic
A share, a building and a bond have one thing in common: each is worth the income it pays, divided by the rate you could earn elsewhere. Halve the rate and the same income is worth twice as much. Nothing about the asset has to change. Not its profits, not its tenants, not its coupon. Only the arithmetic.
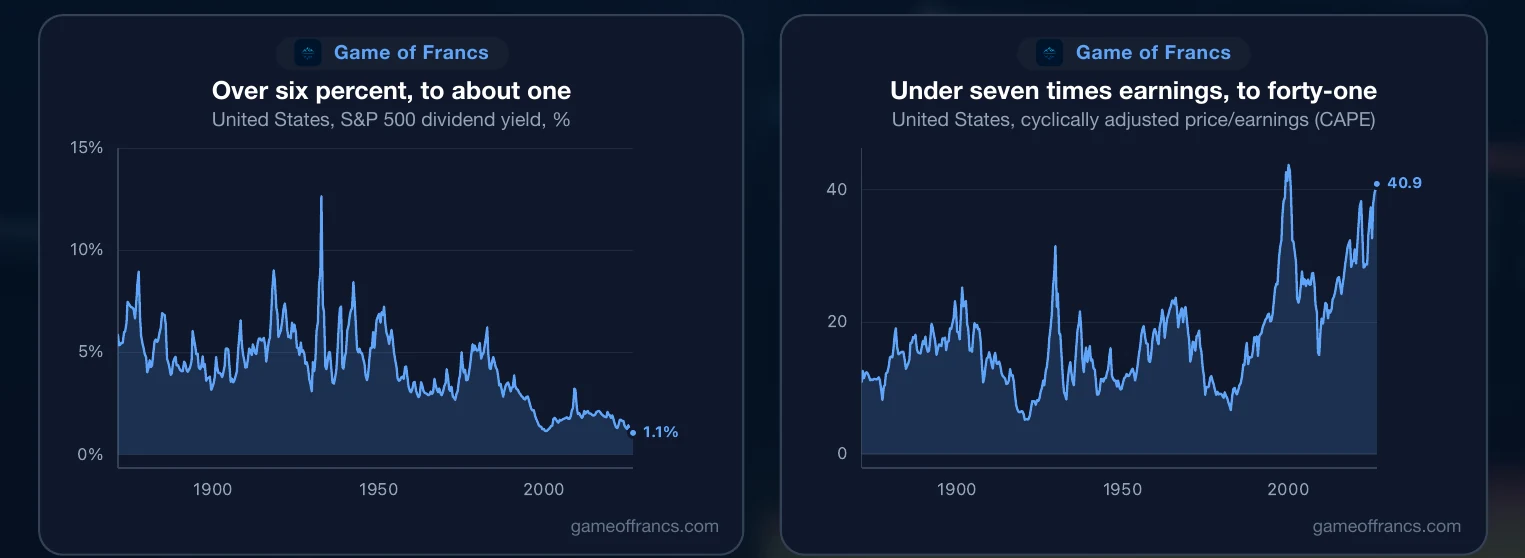
You can watch the arithmetic in the stock market. In 1982, American shares paid more than 6% of their price in dividends every year. Today they pay about 1%, the lowest since at least 1871. The dividends did not shrink. The price paid for them rose.
The same shows in what investors pay for earnings. In 1982 they paid under seven times a decade's average earnings for American companies. They pay 41 times today, a level exceeded only at the top of the dot-com bubble, when it reached 44. That is what a forty-year fall in the price of money looks like from the other side: the income stays, and the price of owning it multiplies.
V. More Money, More Credit
Cheap money did not come alone. It came with more money, and with more credit.
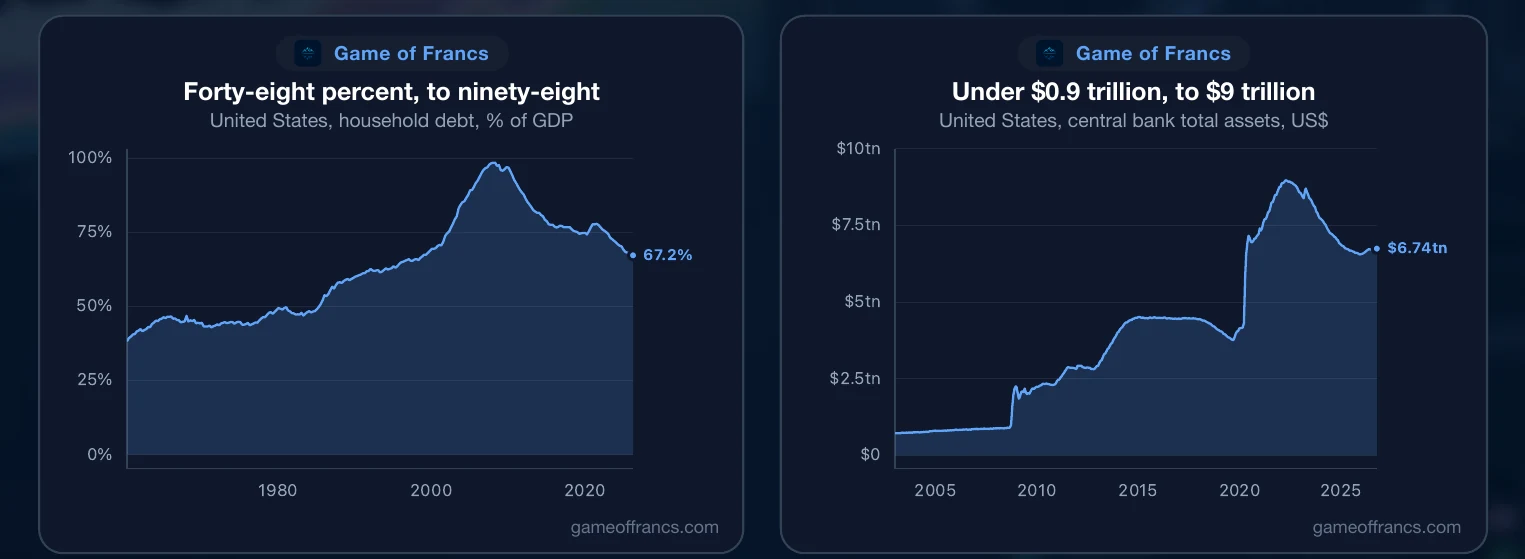
American households owed 47.6% of the country's annual output at the end of 1981. By the end of 2007 they owed 98.4%, twice as much, most of it against their homes. The debt was the other half of the arithmetic: every fall in the rate let the same income carry a larger loan, and the larger loan was spent on assets, which lifted their price again.
When that ended in 2008, the central bank took over. Its balance sheet was under $900 billion at the end of 2007. In April 2022 it peaked just under $9 trillion, ten times larger, built almost entirely from the purchase of government bonds and mortgage securities. It holds $6.7 trillion today.
VI. Where New Money Enters
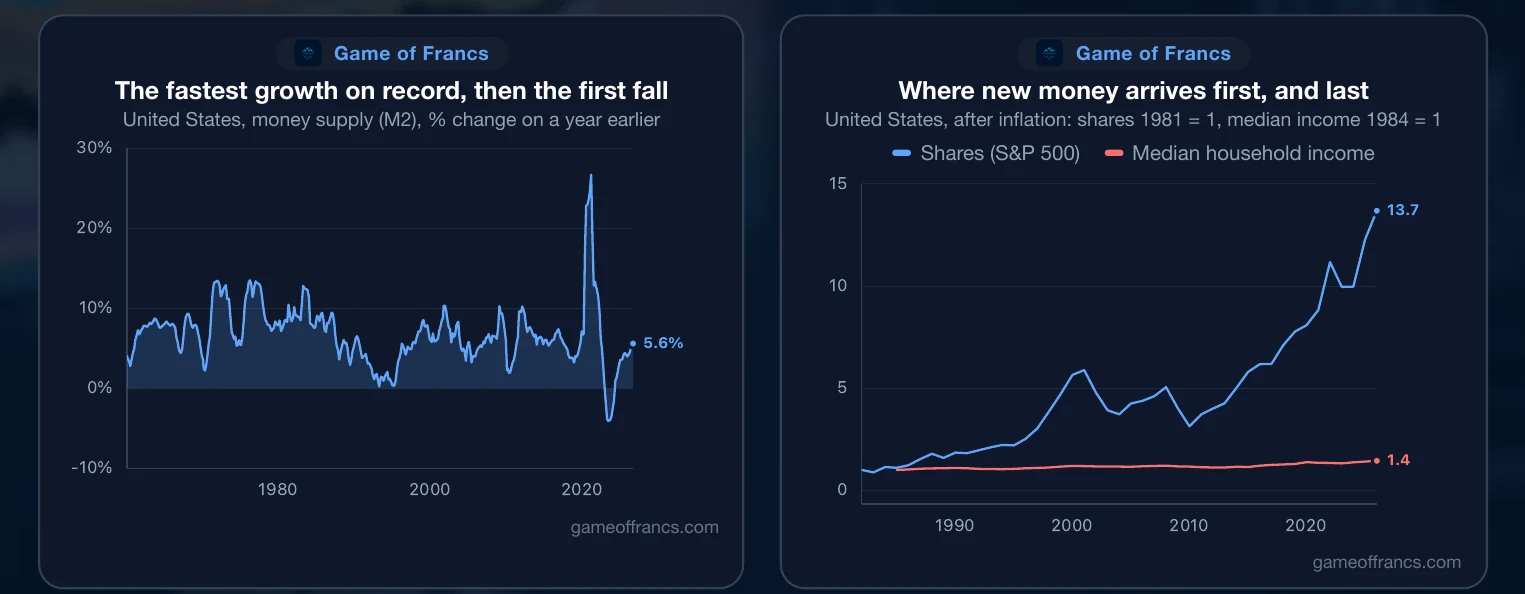
In the year to February 2021, the American money supply grew by 26.7%, the fastest in the whole record since 1960. Two years later it was shrinking, by 4.7% a year, which it had also never done.
An Irish banker named Richard Cantillon noticed something about new money three hundred years ago. It does not reach everyone at once. It enters the economy at a particular place, and the people closest to that place spend it first, before prices have moved. The people furthest away receive it last, after prices have already risen. The same money makes the first richer and the last poorer.
In Cantillon's day new money came out of the gold and silver mines, and it reached the miners, and the merchants who traded with them, first. Today it enters through the financial system: through bond purchases, through bank loans, through credit extended against collateral. The first to feel it are the people who already hold bonds, shares and property, and who can borrow against them. The last to feel it are the people who are paid in wages.
The result is visible in two lines. After inflation, American shares are worth almost fourteen times what they were in 1981. After inflation, the median American household's income rose by 45% between 1984 and 2025. One line is where new money arrives first. The other is where it arrives last.
 United StatesMoney
VII. Who Stands Closest to the Entrance
So who stands closest to the entrance? Divide American households into four groups: the richest one percent, the next nine percent, the forty percent below them, and the bottom half.
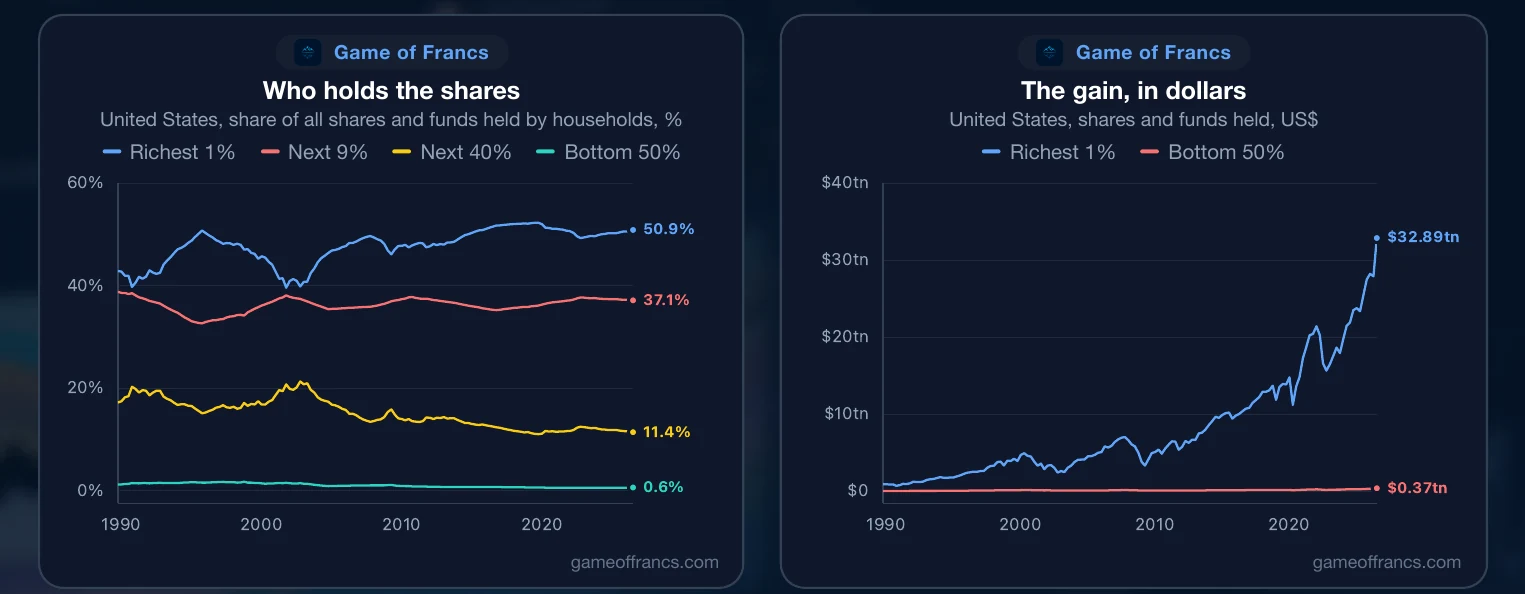
The richest one percent hold 50.9% of all the shares and mutual funds that American households own. The next nine percent hold another 37.2%. The forty percent below them hold 11.4%. The bottom half, half of all the households in the country, holds 0.6%. In 1989 it held 1.2%, and the top one percent 42.8%.
Since the third quarter of 1989, the shares and funds held by American households have gained $62.5 trillion in value. Half of that gain, 51.2%, went to the top one percent. The next nine percent took 37.1%. The bottom half received 0.56%: a little over half of one percent of the whole gain.
None of that required anyone to take anything from anyone. It required only that the thing the top owned rose in price, and that the bottom half did not own it.
VIII. The Portfolios
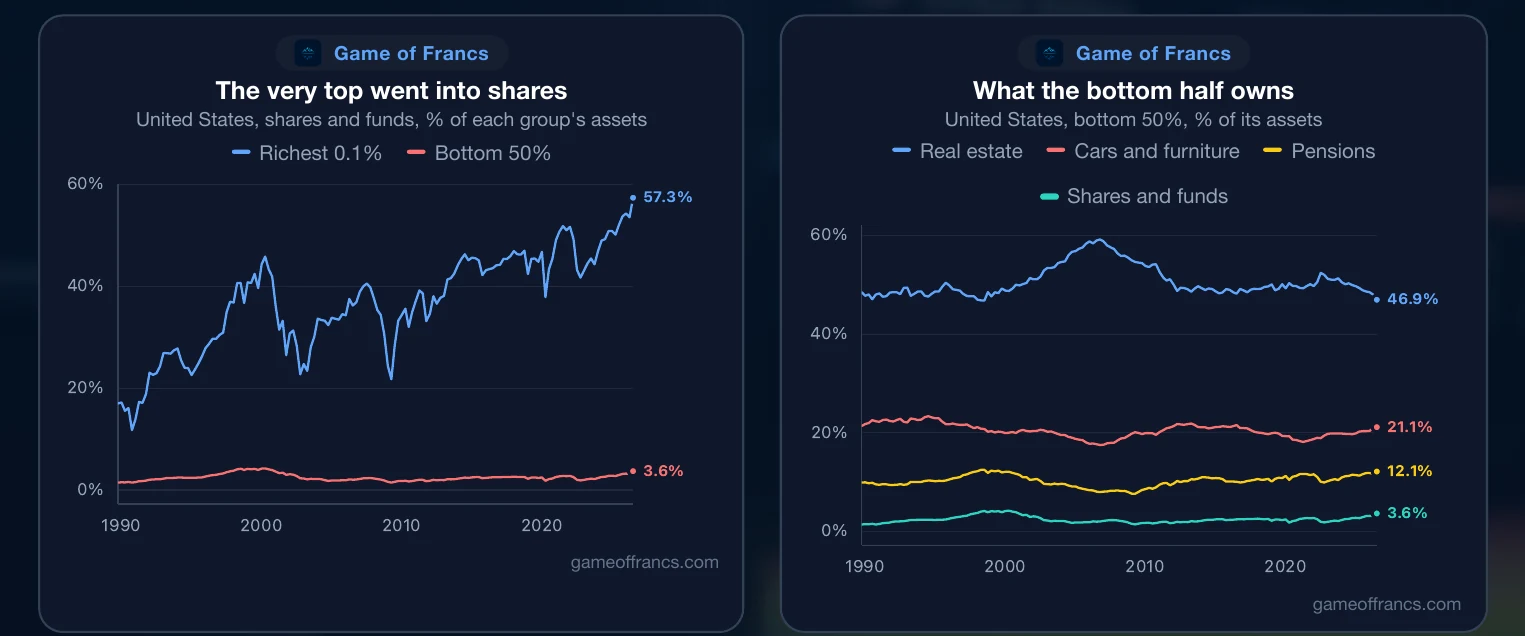
The portfolios tell the same story from the other side. In 1989, the richest thousandth of American households kept 16.9% of their assets in shares and funds. Today they keep 57.3%. As the price of shares rose, shares became most of what the very rich own, which is exactly what would happen if the price rose and nobody sold.
The bottom half owns something else entirely. Almost half of its assets, 46.9%, is a house, and the mortgages against those houses come to 65.6% of their value: most of it is borrowed. Another 21.1% is cars, furniture and other durable goods, which lose value the day they are bought. Pensions are 12.1%. Shares and funds are 3.6%.
A household that owns a car, a sofa and a mortgaged house does not benefit when the price of money falls in the same way as a household that owns a portfolio of shares. The first gets a cheaper loan. The second gets a revaluation of everything it holds.
 United StatesWealth by Group
IX. What the Country Owns
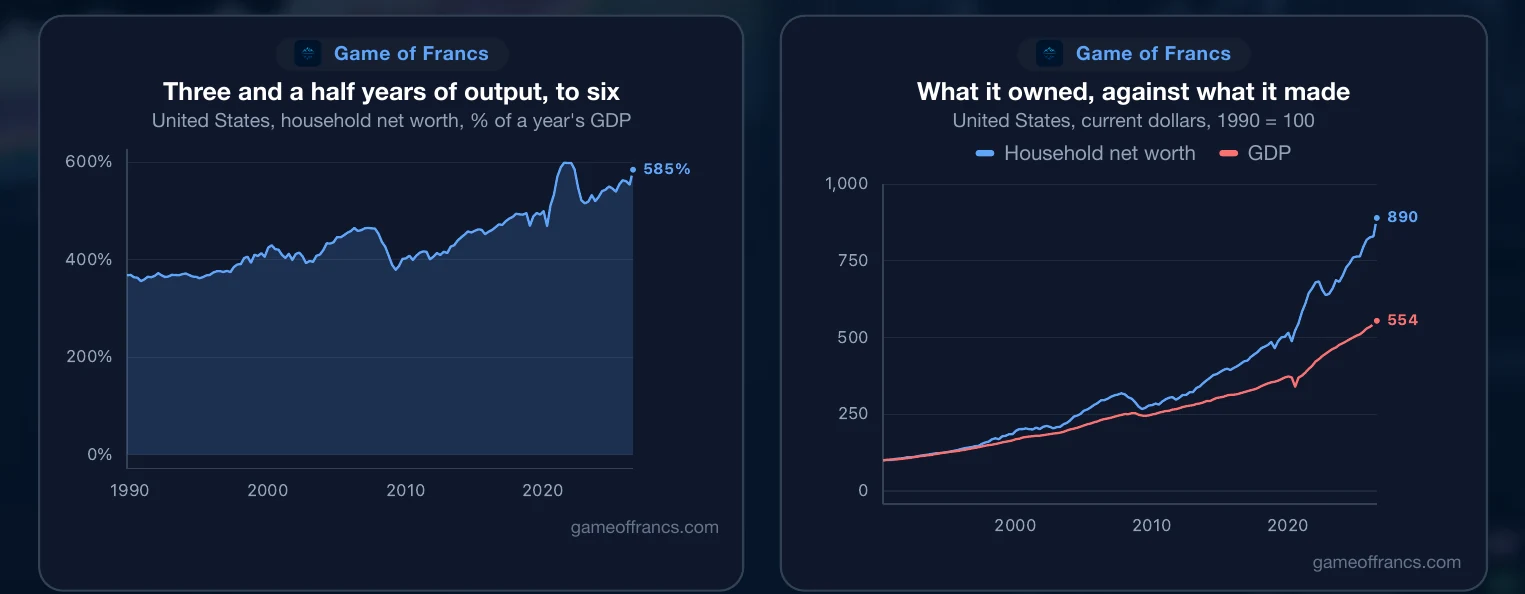
Put the whole country together and the effect is plain. In 1990, American households were worth three and a half years of the country's output. At the end of 2021, at the bottom of the rate cycle, they were worth six.
The country's output grew over those thirty years, in money terms roughly fourfold. What it owned grew far faster, because the same assets were being priced against a falling rate. That gap between what a country makes and what it is valued at is where the record share comes from: the more of a country's worth that consists of revalued assets rather than output, the more that worth belongs to the people who hold the assets. And most of what America owns belongs to the top.
 United StatesGDP
X. The Control Group
If this were only a story about greed, it would look the same everywhere. It does not.
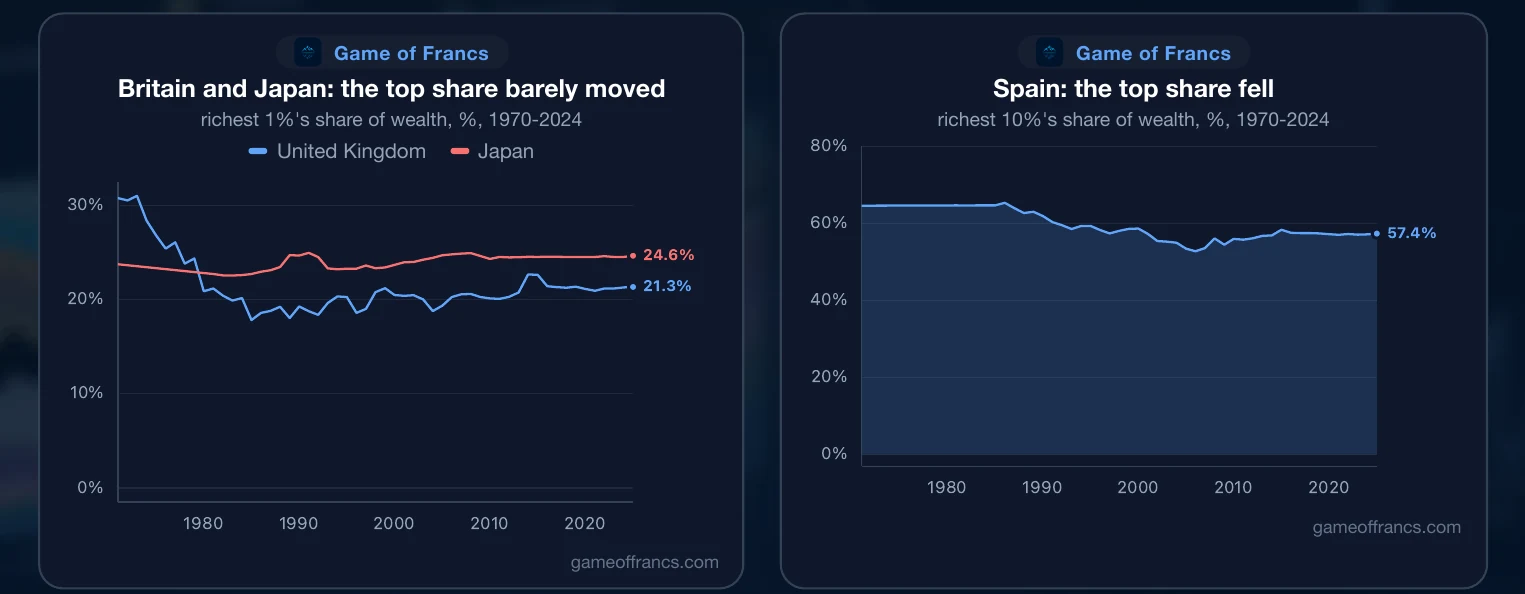
Britain's interest rates fell as far as America's, from 15.6% to a tenth of a percent. Yet the richest one percent held 20.4% of British wealth in 1981 and 21.3% in 2024: less than a point higher after four decades of cheap money. In Spain the share of the top tenth fell, from 64.6% in 1981 to 57.4%. In Japan, where rates have been near zero for a quarter of a century, the top one percent's share has risen by only two points, from 22.5% to 24.6%.
Three rich countries, three central banks that pushed rates to the floor, and none of them produced America's headline. Whatever cheap money does, it does not do it by itself.


XI. What Ordinary Households Own
What differs is what ordinary households own.
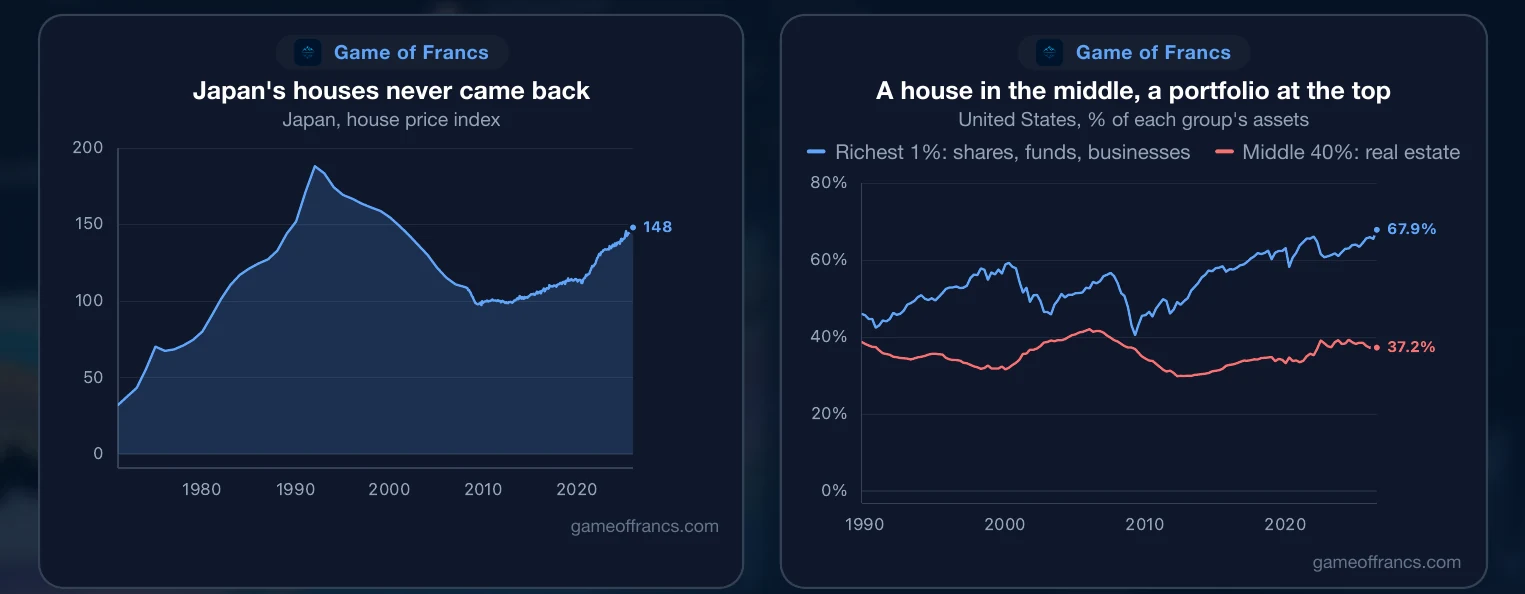
Japan's clearest case is its houses. Japanese house prices peaked in 1991 and are still 21% below that peak today. A generation of near-zero rates never brought them back, so the asset that most Japanese families hold was never revalued, and the gap between them and the top never opened in the American way. In Spain and Britain, the typical household's wealth is a home it owns, and for most of the past forty years home prices rose with everything else. There, cheap money lifted the middle too.
In America the middle forty percent keep 37% of their assets in real estate. The richest one percent keep 68% of theirs in shares, funds and private businesses. When the price of money falls, both rise. But one rises further, and faster, and owns far more to begin with.
Cheap money does not choose winners. It multiplies whatever a country already owns, in the proportions it already owns it. Where wealth means a house, and most families own one, the gain is shared. Where wealth means shares and businesses, the gain flows to the people who hold them.
 JapanPrices
XII. 2022: The Experiment in Reverse
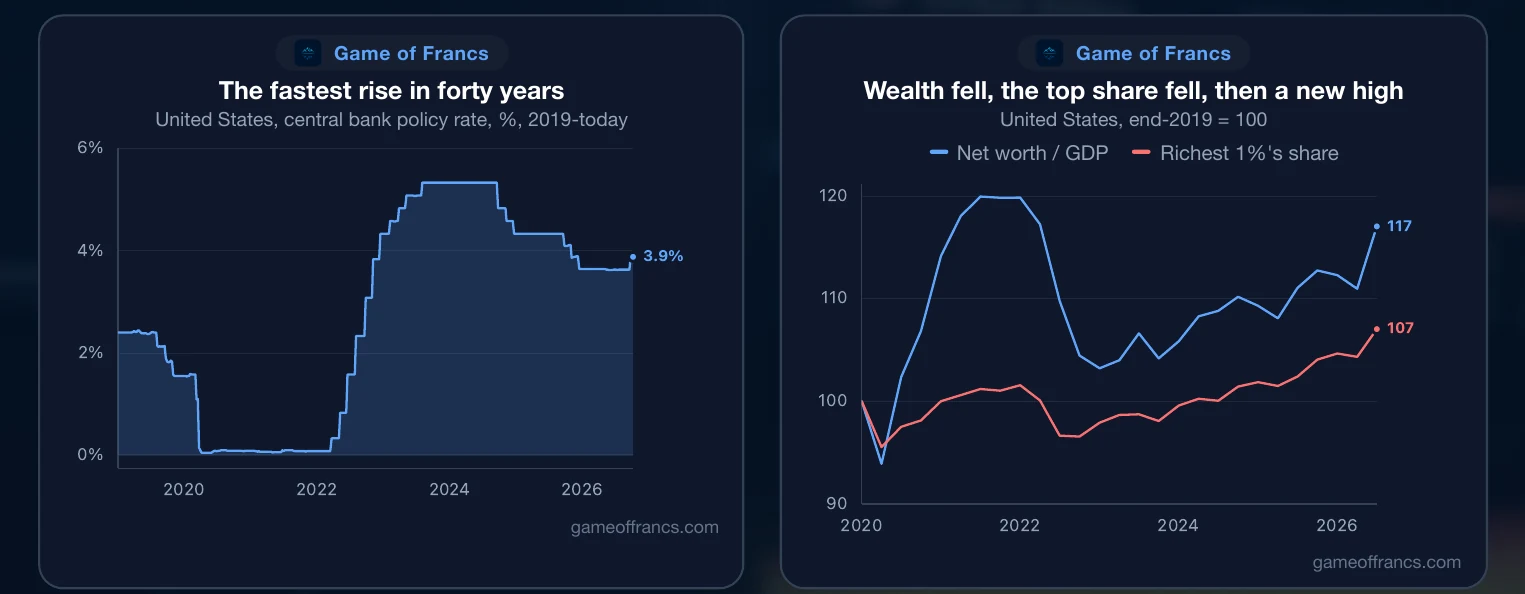
Then the price of money went back up, and the experiment ran in reverse. In 2022 the American central bank raised its rate faster than at any time in forty years: by 4.5 points within twelve months, the steepest rise since 1981. Household wealth fell from six years of the country's output to just over five, by the end of 2022. And the top one percent's share fell with it, from 30.8% at the end of 2021 to 29.3% in the third quarter of 2022. Over the same months, the bottom half's share rose to 2.7%, its highest since 2003.
Nobody had redistributed anything. No tax had changed. The price of money had risen, and the price of what the top owned had fallen further than the price of what everyone else owned.
Then shares recovered. The top share climbed back, passed its old high, and set a new one: 32.5%, the figure behind this year's headline.
 United StatesInterest Rates
XIII. Read the Headline Again
So read the headline again. The richest one percent own a record share. Most of that record was not taken from anyone. It was printed into the price of what they already held, by money that reached them first.
That does not make it fair. A gap that opens because of how money enters an economy is still a gap, and it still decides who can buy a home, who can retire, and who inherits what. But it means the argument is usually aimed at the wrong target. Taxing incomes harder does little to a gap that was never made of income. Blaming greed misses a mechanism that runs whether anyone is greedy or not. The gap in wealth is, above all, a gap in what people own. And for forty years, the price of owning was set by the price of money.
Get the next article by email
One email when a new piece is published. Nothing else, and one-click unsubscribe from any message.