

#10 - The Great Financial Crisis of 2008
Ask what caused the crisis and you get a list: greedy bankers, subprime lending, deregulation, credit default swaps, ratings agencies. Almost every item is true, and not one of them is an explanation. Greed has no date, and it does not explain why the losses landed on one asset, or why the same bust arrived simultaneously in economies that shared nothing except a price. What changed was the price of time — and the audit that the bust began was interrupted rather than completed.
by Game Of Francs Research Team
I. The List That Explains Nothing
Every account of 2008 begins with a list of culprits. Greedy bankers. Subprime lending. Deregulation. Credit default swaps. Ratings agencies that stamped AAA on paper they had not read. Almost every item on that list is true as a description of what happened. None of them works as an explanation of why it happened, and the distinction matters.
Greed has no date. Bankers in 1994 were not less interested in money than bankers in 2005, and 1994 produced no crisis. A cause has to account for timing, and a constant accounts for nothing about timing.
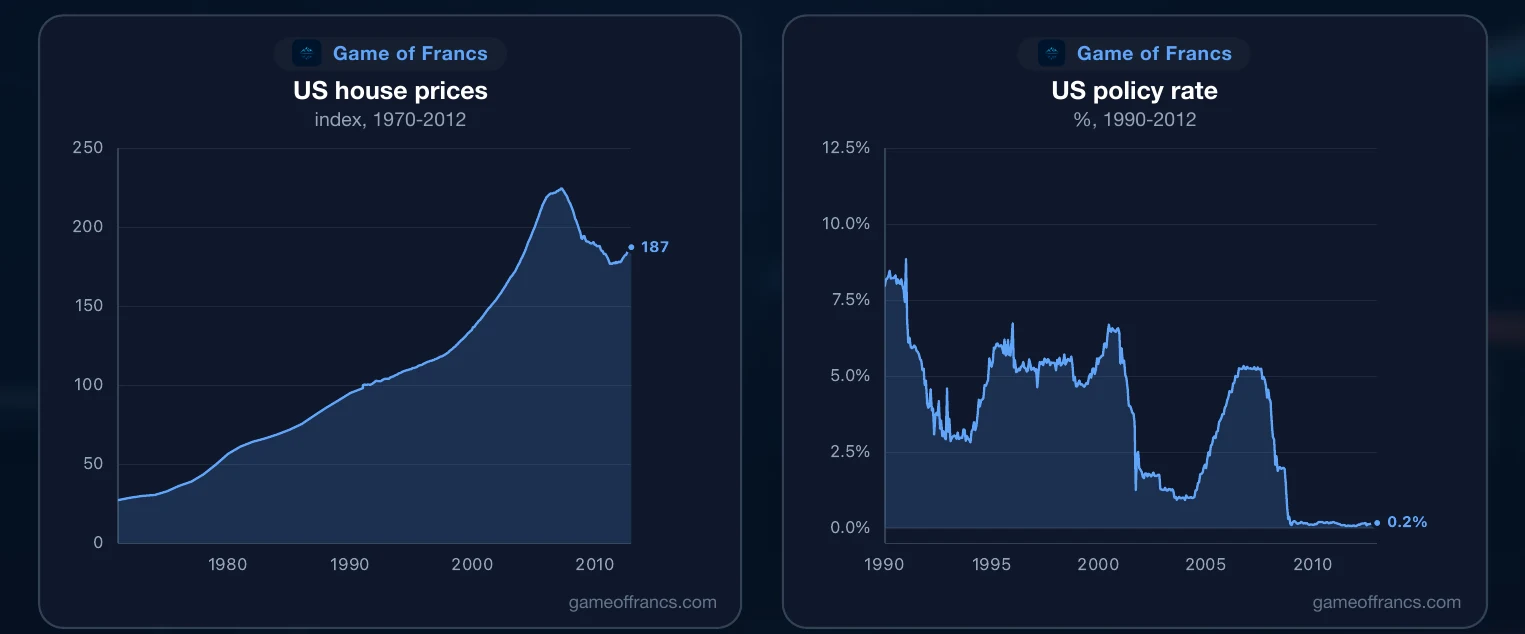
Nor does it account for the target. The losses were not distributed across the economy at random. They concentrated, with something close to precision, on one asset and on the credit stacked on top of it: housing. The US house price index rose 64% between January 2000 and its April 2007 peak, and then fell 21% over the four years that followed.
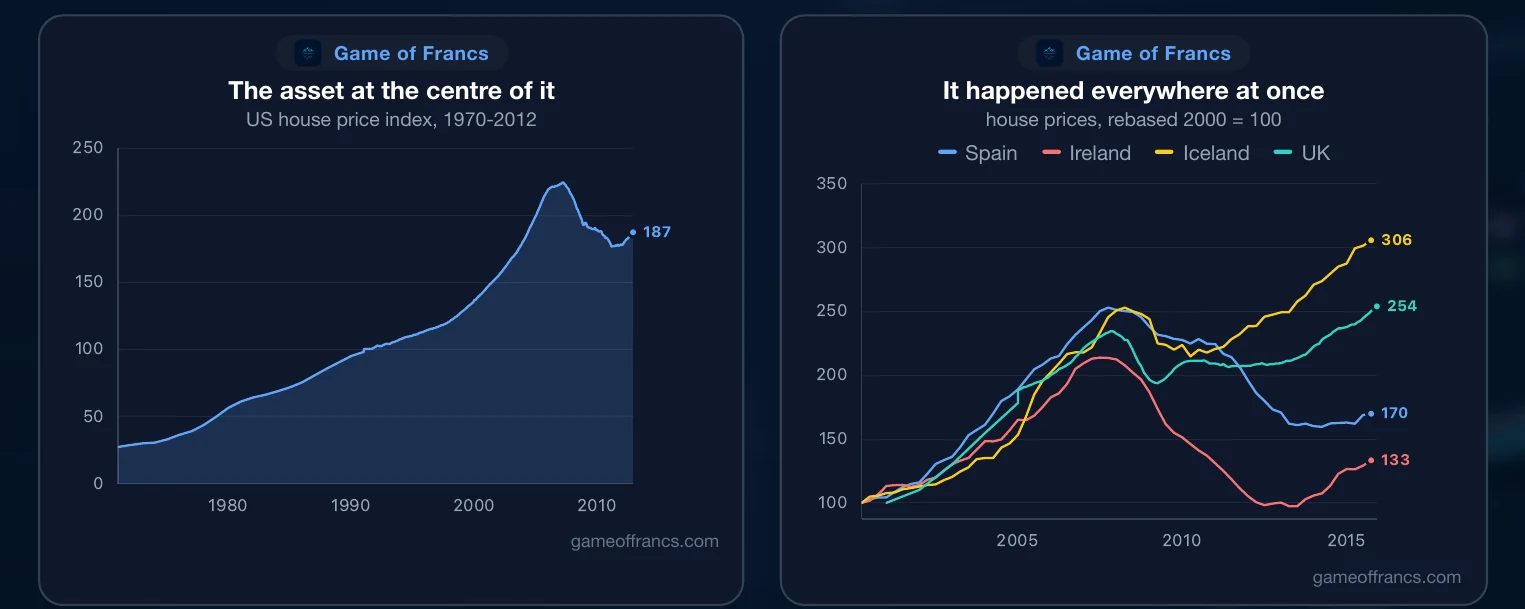
And it fails entirely on the map. The same boom, and then the same bust, ran through Spain, Ireland, Iceland, Britain and Denmark. Different banks, different regulators, different mortgage law, different national character. Something upstream of all of them was acting on all of them at the same time. This piece is an attempt to measure what.

II. The Price of Time
Begin with what an interest rate is. It is not a policy setting. It is a price, and it is the most consequential price in an economy, because it is the price of time. It tells a business what it costs to command resources today for a project that only repays in fifteen years, and it tells savers what they receive for not consuming now.
Left alone, those are the same function. The rate that clears the market is the rate at which the amount people are willing to defer matches the amount investors want to borrow. When it is low, it is low because a society has genuinely chosen to save, and real resources — labour, steel, cement, engineers — have been released from producing for today. The signal and the resources arrive together.
Now suppose the rate is not discovered but announced, and set below the level that savers' actual behaviour would have produced. The signal still travels. Every long-dated project in the economy still learns that the future has become cheap. But the resources are not there, because nobody saved them. Projects begin that cannot all be completed. The economy has been told a story about its own capacity that is not true, and it will build in accordance with that story until reality collects.
That is the mechanism. Everything that follows is bookkeeping.
III. The Cut, and What Money Did
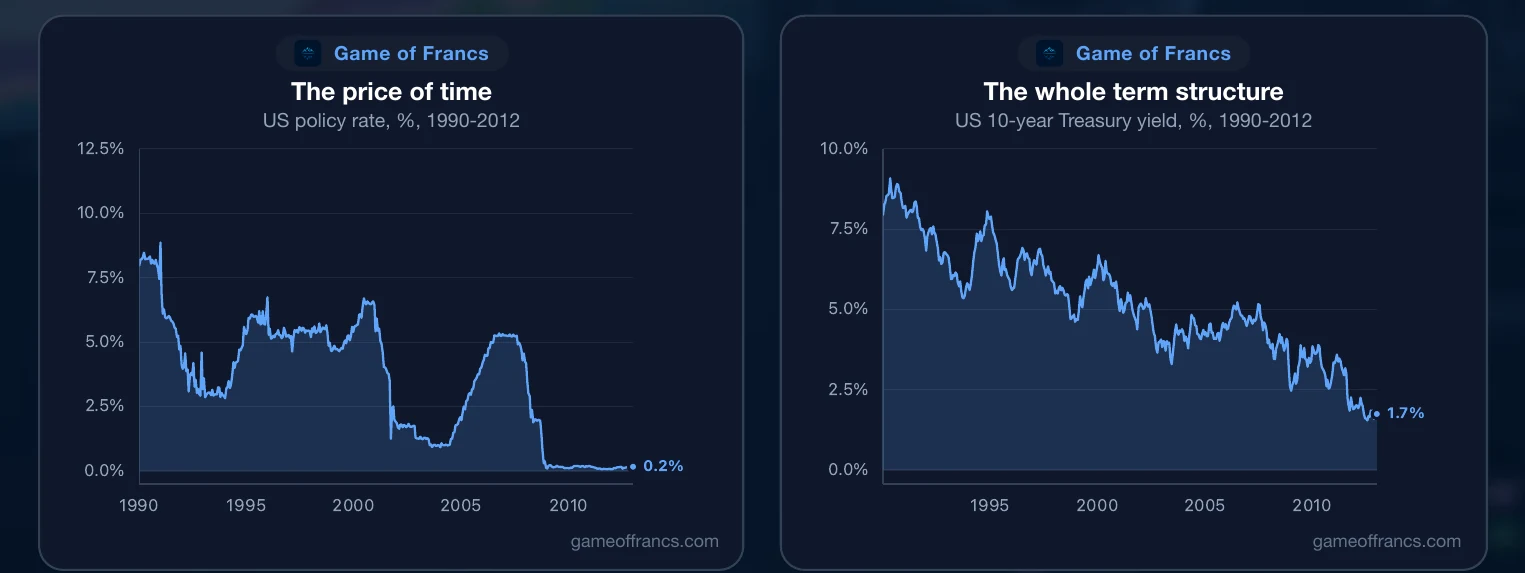
In mid-2000 the Federal Reserve's policy rate stood above 6.5%. The technology bubble broke, a mild recession followed, and the Fed responded as it had to every disturbance since 1987. It cut. By the end of 2001 the rate was under 2%. By the summer of 2003 it was 1%, and it remained below 1.25% for fifteen consecutive months.
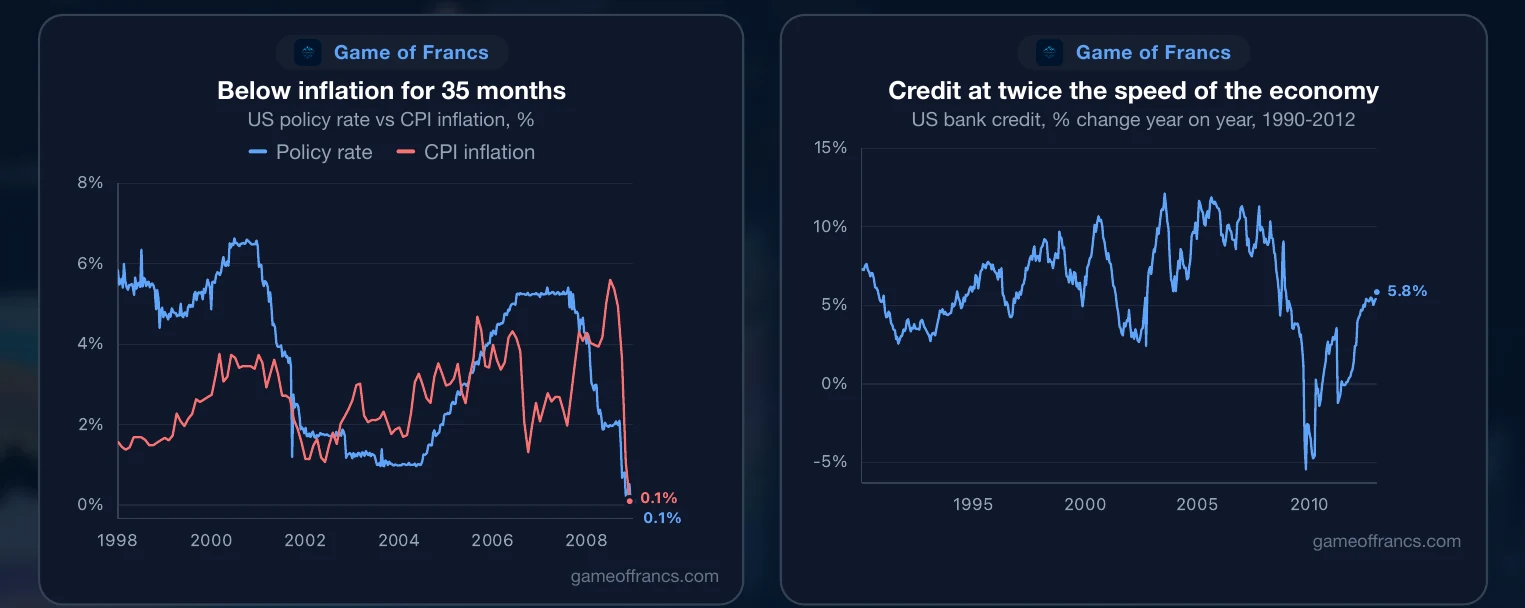
The nominal number understates the position. In 35 months between mid-2002 and late 2005, the policy rate sat below the rate of consumer price inflation. Borrowing was not merely cheap; in real terms, for the better part of three years, it paid. Nor was this confined to the short end. In 2005 the real yield on a 10-year Treasury turned negative for the first time since 1980. The entire term structure of the price of time had been pushed under water.
Money responded. Broad money supply, $4.9 trillion at the end of 2000, reached $7.4 trillion by the autumn of 2007 — half as much money again in under seven years. Bank credit grew at 10% and 11% a year through the middle of the decade, against a nominal economy expanding at roughly half that rate.
IV. Borrowing Up, Saving Gone
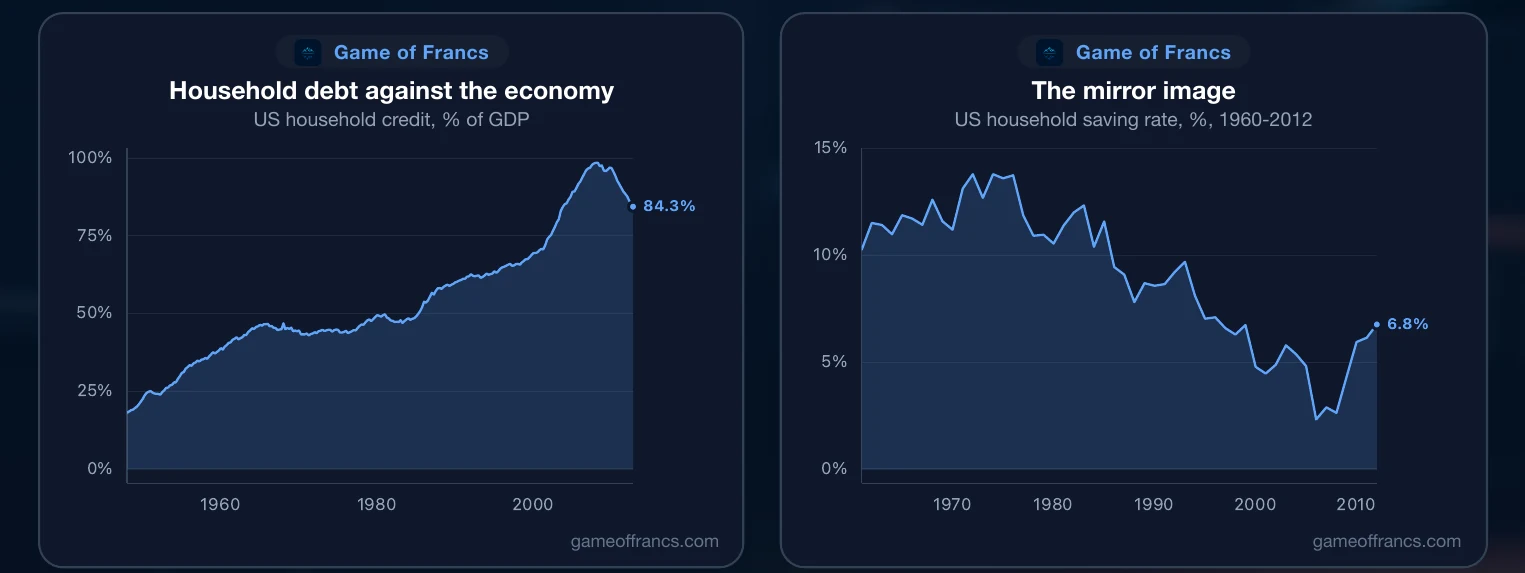
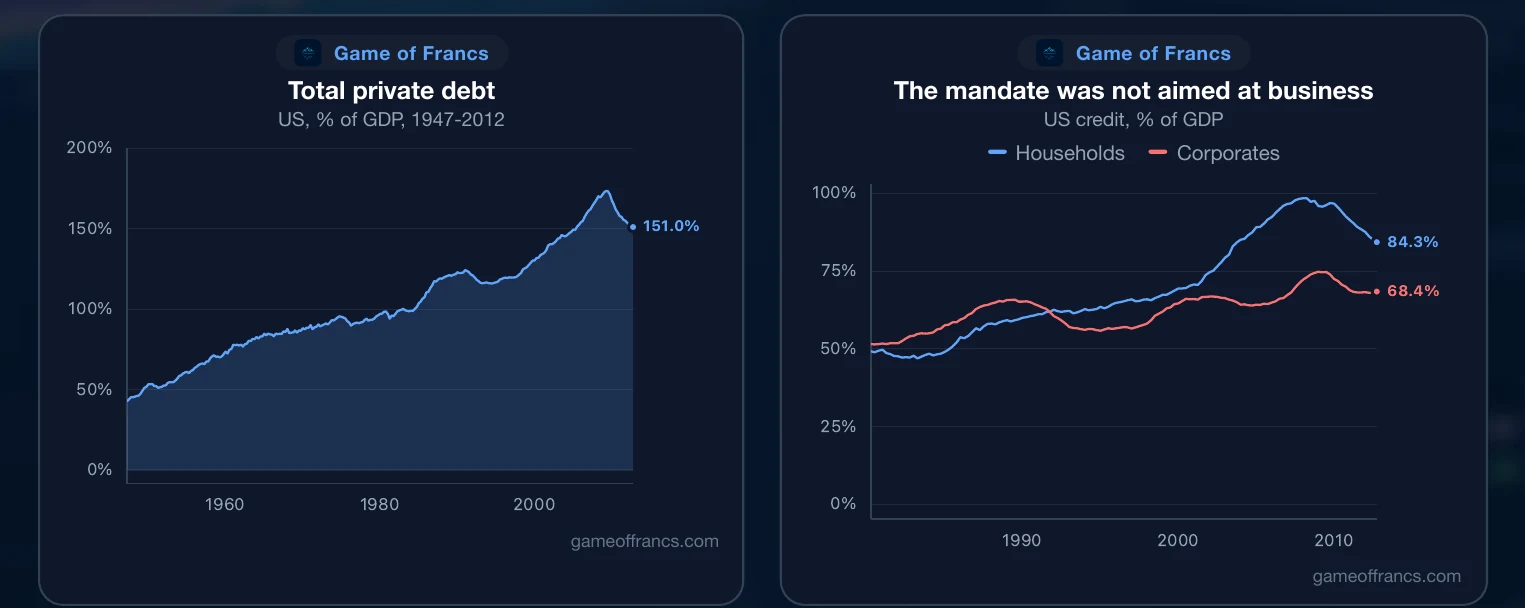
Households did most of the borrowing. Household credit roughly doubled in eight years, from $7.2 trillion to $14.4 trillion, and rose against the economy from 71% of GDP to 98% — the highest reading on record. The share of household income absorbed by debt payments reached 11.6% in mid-2007, a peak the series has never revisited.
Here is the mirror image of that borrowing, and it is the number that matters most. The American household saving rate fell to 2.3% in 2005, the lowest annual reading since 1960.
Read those two facts together, because together they are the argument. Investment was booming while saving was collapsing. The resources required to complete what was being started did not exist. What presented as a country growing richer was a country consuming its capital while the accounting reported otherwise.
V. Where the Credit Went
So where did the credit go? Where the mechanism says it must: into the longest-lived, most interest-sensitive asset the economy owns. A house is a thirty-year cash flow. Its value depends on the price of time more than almost anything else that can be bought. When time is mispriced, houses are mispriced first and worst.
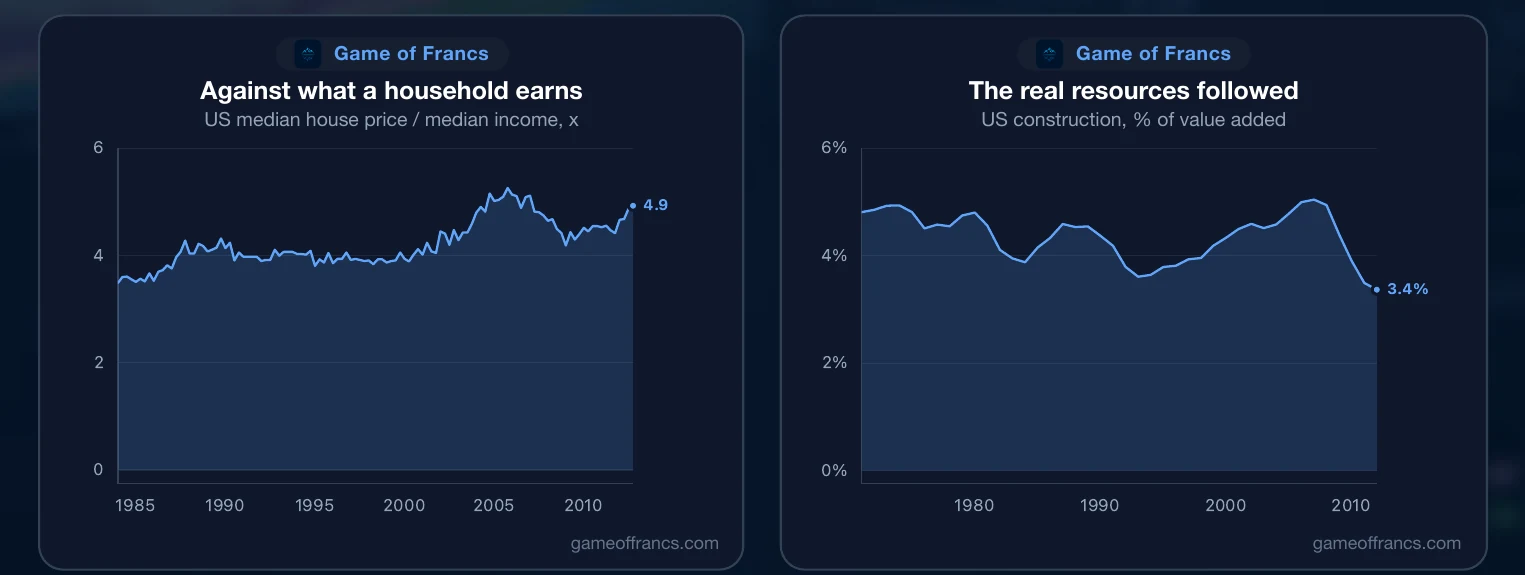
The median American home cost 3.9 times median household income at the start of 2000. By early 2007 it cost 5.1 times. Measured from 1996, the national house price index very nearly doubled.
Capital followed the price. Construction reached 5.05% of American value added in 2006, the highest share in a series running back to 1970. These are not abstractions. They are cranes, cement plants, mortgage brokerages and framing crews, built at a scale the country would not need, financed at a price that was not real.
VI. The Alarm in the Wrong Room
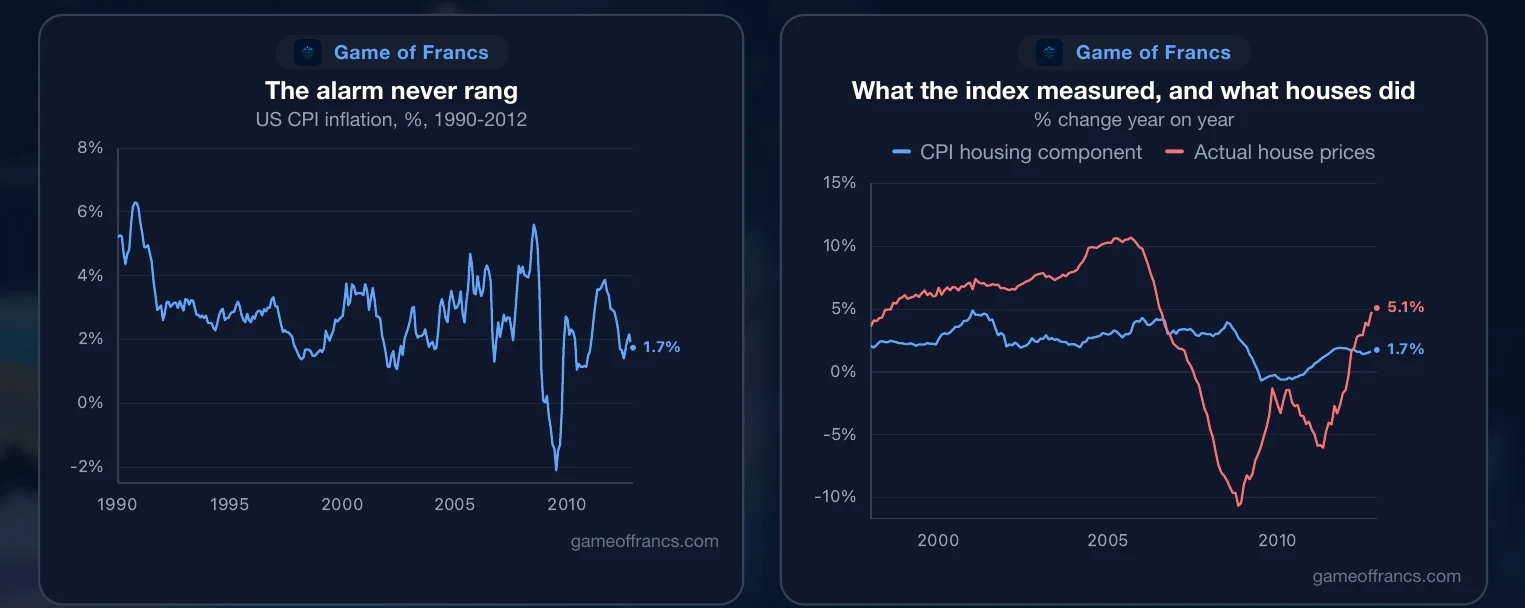
Through all of it, the instrument used to detect danger read normal. Consumer price inflation averaged under 3% through the heart of the boom. The alarm never sounded, because the alarm was not wired to the room where the fire was.
There is a specific reason for that. The housing component of the consumer price index does not measure house prices. It measures what a home would rent for. At the peak, that line rose about 4% a year while the houses themselves rose more than 10%. The largest single expenditure in a household budget was inflating at a rate the statistic was constructed not to see.
Policymakers looking at consumer prices concluded there was no inflation problem. They were reading the instrument correctly. The instrument was pointed at the wrong thing — and an instrument that cannot see the asset absorbing the credit will always report calm during a credit boom.
VII. Fifteen Years of Housing Policy
None of this was a free market discovering its own limits, and it is worth being exact about why. For fifteen years, raising the homeownership rate was the declared policy of the United States government, under both parties, pursued with numerical targets.
It began with a law signed in October 1992, by a Republican president, directing the housing department to set affordable-lending goals for the two mortgage agencies. Three years later the Clinton administration turned that authority into a campaign: the National Homeownership Strategy, subtitled *Partners in the American Dream*, assembled 58 organisations behind a single stated objective — to raise homeownership to an all-time high of 67.5% by the year 2000, adding as many as eight million new homeowning families.
The target was met, and the mechanism used to meet it was a quota. The share of the mortgage agencies' lending required to go to low- and moderate-income borrowers was set at 40% in 1996, 42% from 1997, 50% from 2001, and then 52%, 53%, 55% and 56% for the four years from 2005. Each of those numbers is an obligation on a buyer, and it had to be filled, whatever underwriting standard was required to fill it. The ratchet did not pause when the administration changed: in June 2002 the Bush administration announced the Blueprint for the American Dream, committing to 5.5 million new minority homeowners by the end of the decade, and in December 2003 it signed the American Dream Downpayment Act, putting federal money directly into the deposit.
The homeownership rate reached 69.2% in the last quarter of 2004, the highest ever recorded. By mid-2016 it was 62.9%, the lowest since 1965, and below where it stood when the strategy began. Two presidents, fifteen years and a great many programmes did not produce more owners. They produced more borrowers.
It is worth stating plainly what that does and does not prove, because the popular version of this argument goes considerably further than the evidence supports. The Community Reinvestment Act is the usual villain, and the numbers do not carry it: the crisis commission found that only 6% of high-cost loans had any connection to the Act at all, and the Federal Reserve governor who reviewed the research concluded in December 2008 that it was not among the causes. Nor were the mortgage agencies the leaders in the worst years — they were followers. Private-label securitisation, paper the government neither sponsored nor guaranteed, went from 22% of issuance in 2003 to 56% by 2006. The worst loans were written outside the government's channel, by firms with no goal to fill. And the reform that might have restrained the agencies failed to pass under a Republican Congress as readily as under a Democratic one.
So the homeownership push is not the cause, and anyone selling it as the cause is selling a party's version of the story rather than the story. It is a cause of a particular kind. It did not create the credit; the rate did that. What it did was aim it.
VIII. The Rules That Paid for It
Then the rules made the paper irresistible to hold. In November 2001, American bank regulators finalised a rule on how much capital a bank must hold against mortgage risk. Hold an ordinary mortgage on the books and it carried a 50% risk weight. Slice the same mortgages into a security, obtain a AAA rating on the senior tranche, and hold that instead, and the risk weight fell to 20%. Required capital on those tranches fell from between 4% and 8%, to 1.6%.
That is the clearest single fact in this story. The state made it roughly four times more expensive, in capital terms, for a bank to hold a mortgage than to hold a security made out of mortgages. Securitisation was not a clever evasion of the rules. It was the behaviour the rules paid for.
The same logic ran through the rest of the structure. The ratings that determined those capital charges came from a handful of firms the regulator itself had designated — a licensed oligopoly, paid by issuers, whose opinions had been written into law. In 2004 the securities regulator allowed the five largest investment banks to measure their own risk with their own internal models. And the two giant mortgage agencies borrowed at rates the market offered only because everyone assumed the government stood behind them, an assumption proved correct in September 2008.
At every level, the same architecture: risk borne privately in the profit, and publicly in the loss. That is not a market outcome. It is a subsidy for taking risk, and the market did precisely what a subsidy is designed to make it do.
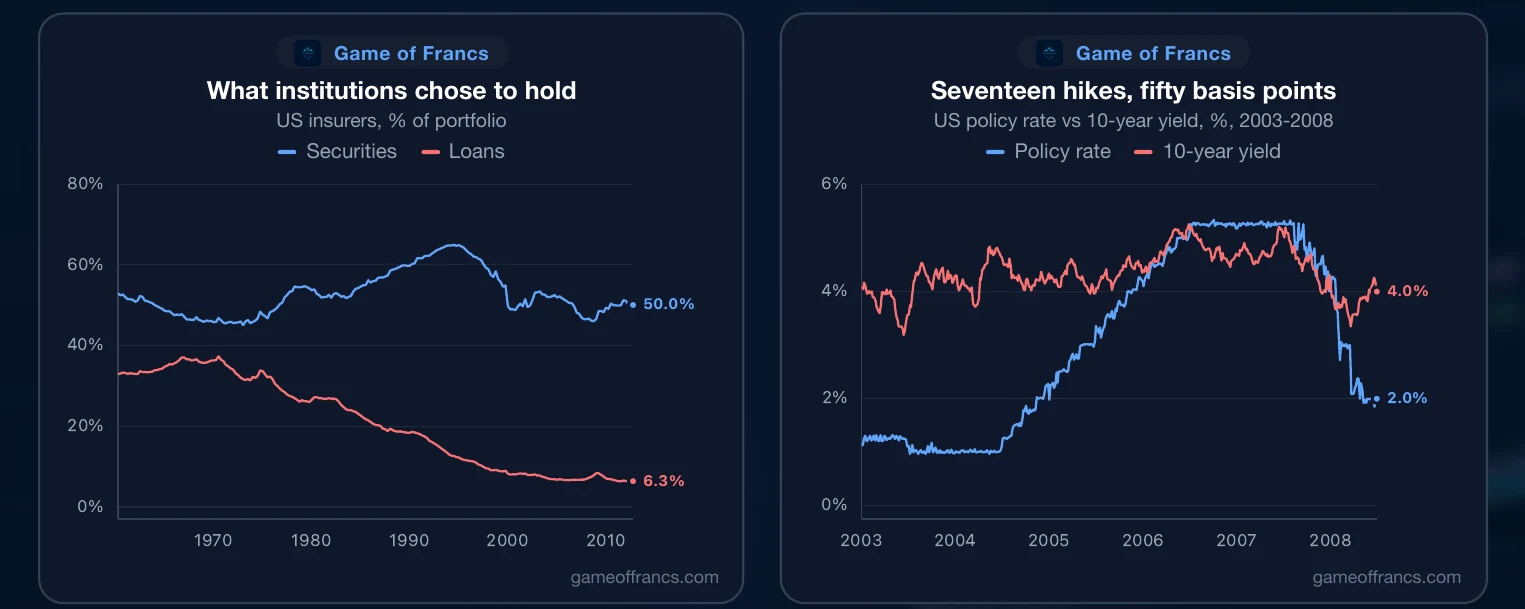
There is one further piece, and it is the one the architects themselves pointed to. Between June 2004 and June 2006 the Federal Reserve raised its policy rate seventeen consecutive times, from 1% to 5.25%. The 10-year Treasury yield, which is what mortgages are actually priced off, went from 4.7% to 5.2%. Four hundred basis points of tightening at the front end produced fifty at the long end, and the Fed's chairman called it a conundrum. It was not one. The American current account deficit reached 5.9% of output in 2006, the widest in the series, and it was financed largely by foreign central banks. China's current account surplus went from 1.3% of its output in 2001 to 9.8% in 2007, and its reserves from $212 billion to over $1.8 trillion — recycled into the American bond market, holding down the very yield that priced every mortgage in the country.
IX. One Rate, Three Countries
The international evidence is the closest thing this subject has to a controlled experiment, and it is decisive.
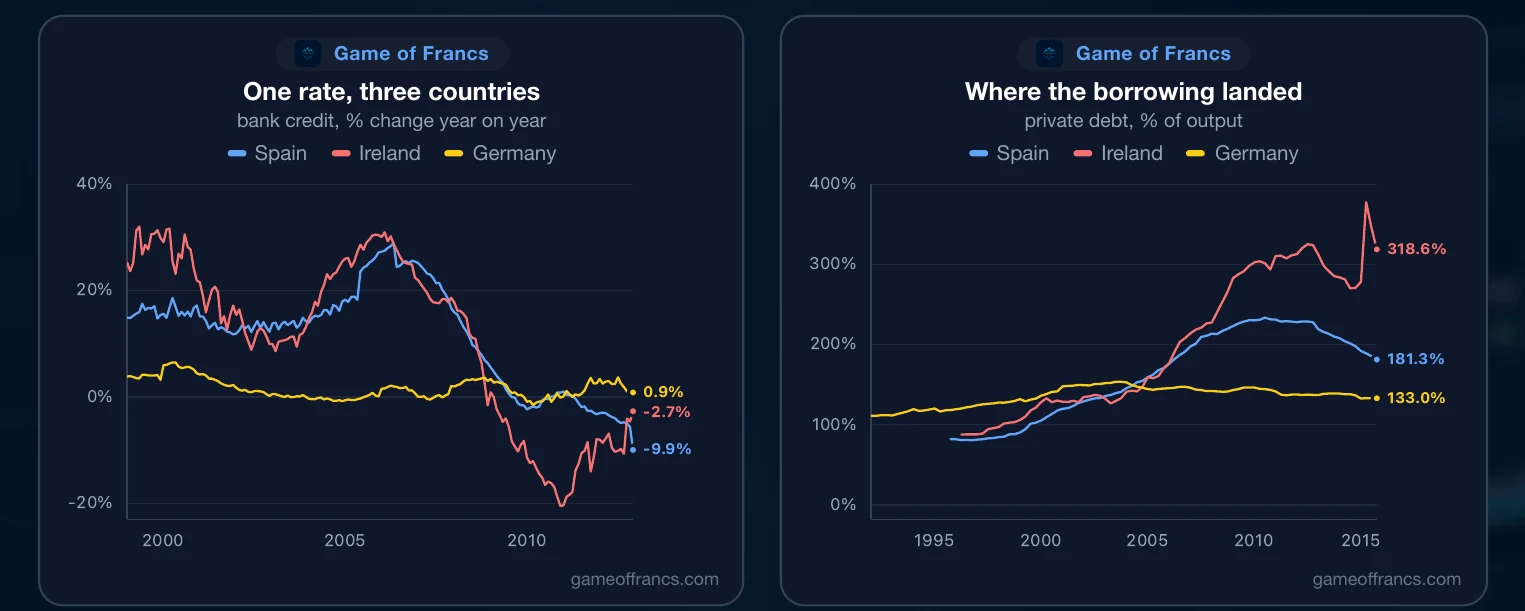
Spain, Ireland and Germany shared a currency and therefore shared a single interest rate, set in Frankfurt, identical to the decimal point in all three countries. The European Central Bank held its main rate at 2% from mid-2003 to the end of 2005. For Germany, still absorbing reunification with low inflation, 2% was restrictive. For Spain and Ireland, inflating faster, the same 2% was deeply negative in real terms.
The outcomes were not subtle. Spanish bank credit grew 29% in a single year. Irish bank credit grew 31%. German bank credit, across those same years, averaged under half a percent. By 2007, private debt stood at 214% of output in Spain and 227% in Ireland, against 142% in Germany, where it had fallen over the boom years.
Same currency, same policy rate, same continent, same decade, and three completely different outcomes — tracking the gap between the announced rate and what each economy's own conditions would have required. Germany did not escape a housing bubble because German bankers were more prudent than Irish ones. It escaped because the rate imposed on it happened to be too high rather than too low.
Which exposes what the entire framework depends on. There is no single correct interest rate for twenty economies, and there was never one for a single economy either. The rate is meant to summarise millions of individual judgements about the future. A committee cannot compute it, because the information does not exist anywhere to be computed; it exists only in the act of exchange.
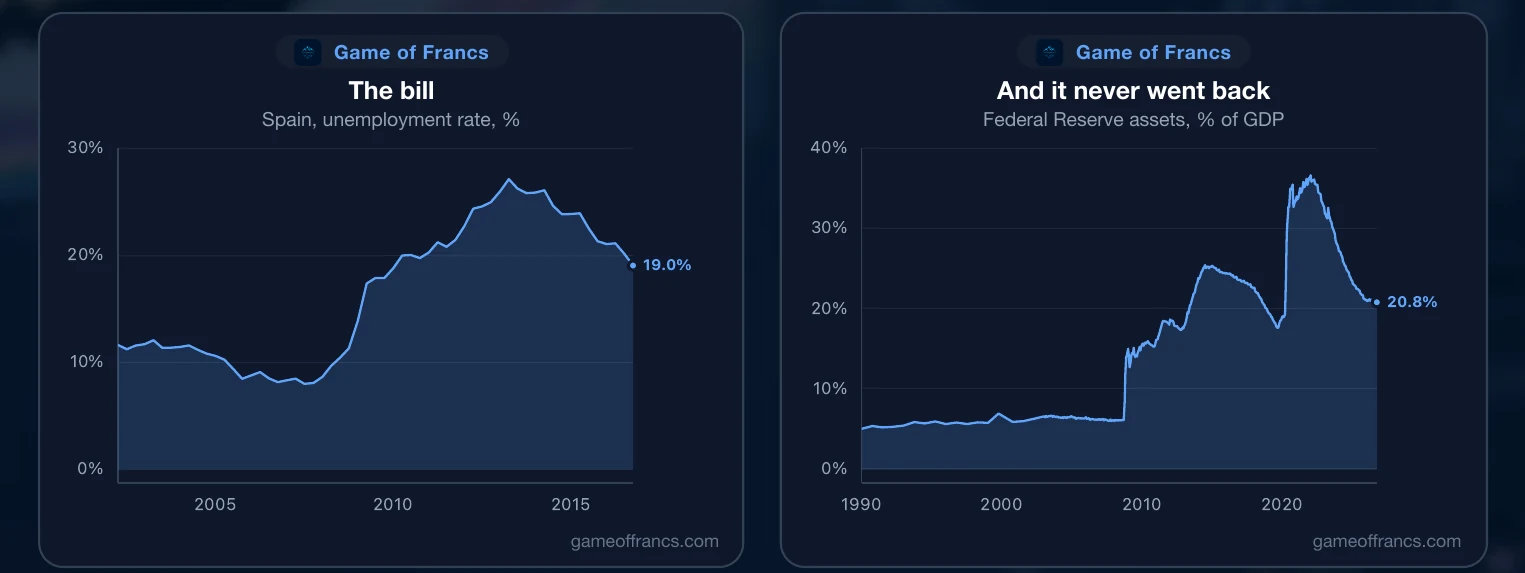
The bill arrived on schedule. Irish house prices fell 54% from peak to trough. Spanish house prices fell 37%. Spanish unemployment went from just under 8% in 2007 to 27% in 2013. And Irish private debt did not fall after the crash — it rose to 378% of output by 2015, because output collapsed faster than the debt.
X. The Cure, and What It Bought
The warnings were sitting in the price of time itself. The American yield curve inverted: the 10-year yield fell below the 2-year on 238 trading days between December 2005 and June 2007. House prices turned over in April 2007, seven months before the equity market noticed. And volatility printed 9.89 in January 2007, a level it had not touched since 1993. The system was most confident at the moment it was most fragile.
What followed needs the least description. Credit markets seized in the summer of 2007. Bear Stearns failed in March 2008, Lehman Brothers in September. High-yield bonds lost more than a third of their value, and equities fell 57% from October 2007 to March 2009.
But the crash was not the crisis. The crash was the discovery. Nothing was destroyed in 2008 that had not already been wasted in the years before it — the houses in the wrong places, the brokerages with nothing to broker, the capital sunk into construction the country did not need. All of it was consumed during the boom, while everyone felt rich. The bust is when the accounts are restated to show what was actually there. It is painful in the way a diagnosis is painful, and about as responsible for the disease.
Which brings us to the response. The rescue was designed and executed by the people who had built the conditions. The chairman who set the rate at 1%, and who in February 2004 publicly encouraged households to move out of fixed-rate mortgages into adjustable ones, retired in January 2006, weeks before the peak, and returned in October 2008 to tell Congress he had found a flaw in his model of how the world works. His successor was the same governor who had argued in 2002 that the printing press was always available, and who said in July 2005 that there had never been a decline in house prices on a nationwide basis — true only of the years after 1945, since the long index shows nationwide declines of 27% in 1907 and of 12%, 16% and 18% in the first three years of the 1930s. The president of the New York Fed through the boom, supervisor of the institutions that failed, became Treasury Secretary in 2009; the Treasury Secretary who designed the bank rescue had run one of the rescued firms until 2006.
None of this requires a conspiracy, and it is a weaker story if you make it one. It requires only that a small group held a sincere theory, that the theory was wrong, and that when it failed those same people were the only ones considered qualified to decide what came next. Diagnosis and remedy were written by one hand, and the remedy was more of the thing that had caused the problem. Emergency lending to banks went from $173 million in October 2007 to $441 billion a year later. Dollar swap lines went from nothing to $583 billion. The Fed began buying mortgage securities, an asset class it had never held, reaching $1.1 trillion by 2010. Its balance sheet went from 6% of American output to 13% inside six months, and never went back; it is above 20% today.
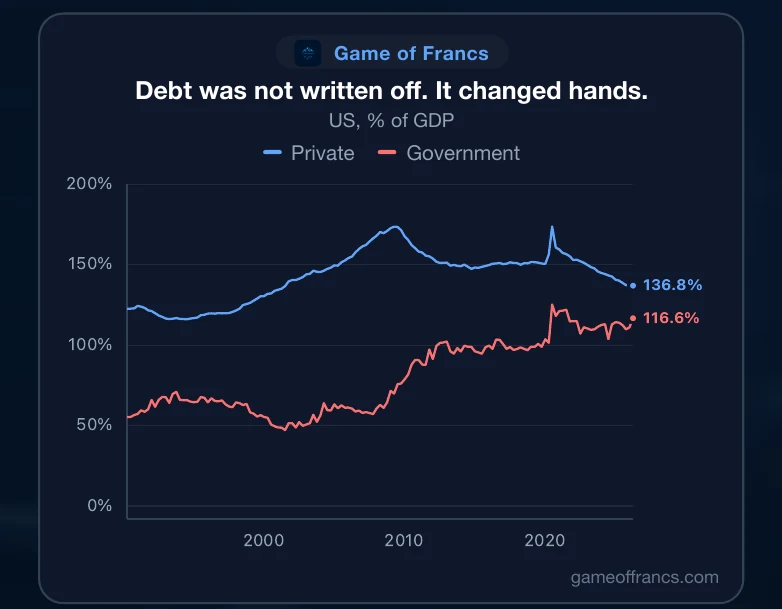
Be fair about the counterfactual. A monetary collapse in 2008 would have been catastrophic, and the people who prevented it were not wrong that it was possible. What can be said with confidence is what the rescue purchased, and what it cost. It purchased time. The cost was that almost nothing was allowed to be discovered. Debt was not written off; it changed hands. American private debt fell from 168% of output to 137%, while government debt rose from 57% to 111%, and total public debt went from 85% of output at the end of 2007 to 134% today. Globally the same: total debt across the major economies stood at $99 trillion at the end of 2006 and stands at $265 trillion now. There was no deleveraging. There was a transfer, and then a resumption.
Nor was the distribution neutral. Policy that works by lifting asset prices delivers to whoever owns assets. The wealth share of the bottom half of American households, already only 0.2% in 2006, went negative and stayed negative for years, while the top 1% share rose from 33% to 37%.
And the mispricing was never corrected. American houses cost 5.1 times median income at the 2007 peak that everyone agreed was a bubble. They went further still in late 2022, to 5.9 times, and cost 4.7 times today — back to where they stood in 2004, and above every year before it. Priced in an asset that cannot be created by announcement, the arithmetic is starker still: the median American house cost 400 ounces of gold at the end of 2006 and 125 ounces by the start of 2025.
So what caused 2008? Not a shortage of rules — the rules were the incentive. Not an excess of greed — greed was constant. What changed was the price of time. It was set too low, for too long, by an institution that could not have known the right number, and that had spent two decades teaching everyone it would always be there to cut again. The boom was not the good part that was later ruined. The boom was the damage; the bust was the audit. And the audit was interrupted, by the same people, using the same instrument, in the belief that the discovery itself was the disaster.
Which leaves one uncomfortable question. If the cause was never diagnosed, and the correction was never completed, and the price of time is still set by announcement rather than by discovery, then what happened in 2008 was not a crisis that was solved. It was one that was postponed.
 United StatesDebt
Get the next article by email
One email when a new piece is published. Nothing else, and one-click unsubscribe from any message.