
#9 - The Big Cycles
Markets are addicted to the short term, but the forces that decide whether a currency keeps its crown, whether a debt load stays sustainable, or whether a great power holds together move on a timescale of decades. Through Ray Dalio's Big Cycles lens — the long debt and money cycle, the internal cycle of order and disorder, and the external rise and fall of great powers — this is an attempt to zoom out from the headline and ask a single question: where in the long arc are we actually standing?
by Game Of Francs Research Team
Markets are addicted to the short term. A rate decision, an inflation print, an election result: each is treated as if it were the whole story. But the forces that decide whether a currency keeps its crown, whether a debt load stays sustainable, or whether a great power holds together move on a timescale of decades. They turn so slowly that almost no one alive has watched a full rotation, which is exactly why each generation is caught by surprise.
I. The Machine Beneath the Headlines
This is the territory Ray Dalio calls the Big Cycles: the recurring, almost mechanical patterns of rise and fall he traces across five centuries, from the Dutch guilder to the British pound to the US dollar. You don't have to accept every detail to find the lens useful. Its value is that it forces you to zoom out from the headline and ask a single question: where in the long arc are we actually standing?
The model rests on three big cycles that turn at once, plus two forces that amplify them. The first is the long debt and money cycle. The second is the internal cycle of order and disorder, meaning how cohesive or divided a society is. The third is the external cycle, the rise and fall of great powers and their currencies. Layered on top are two wildcards: acts of nature, such as pandemics and floods, and human inventiveness, meaning technology.
What makes the framework powerful is that these cycles are correlated. A country that borrows too much tends, a generation later, to face widening wealth gaps and sharper political conflict; a country in internal disorder is a weaker competitor abroad; a weakening external power eventually loses the confidence that underwrites its currency. The cycles feed one another, which is why decline, when it comes, tends to arrive on several fronts at once rather than one at a time.
None of this unfolds on a schedule. Cycles are probabilistic, not clockwork, and the wildcards can bend the path. The point of the framework is not prediction. It is orientation: knowing which era you are in. We begin with the cycle that sets the tempo for all the others. That cycle is debt.
II. The Long Term Debt & Money Cycle
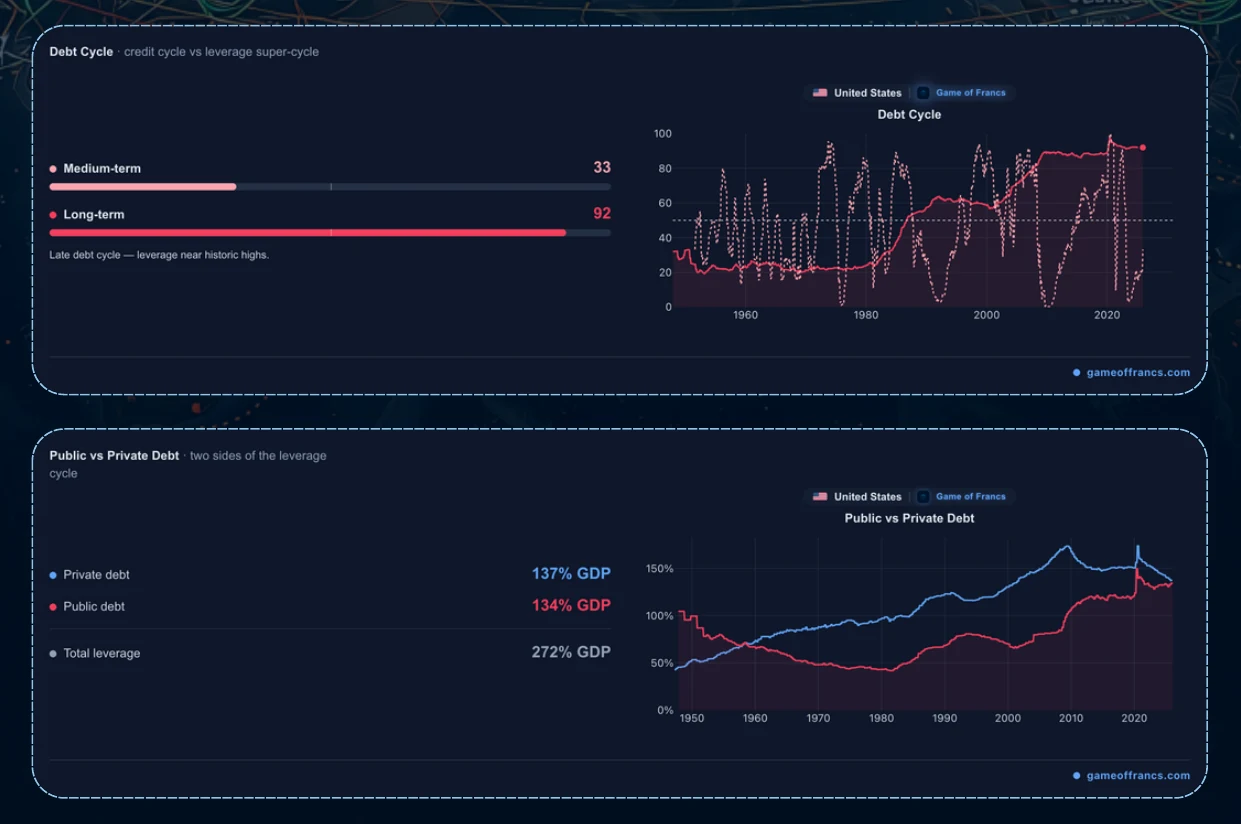
Credit is productive, until it isn't. Over a long expansion, often lasting fifty to a hundred years, an economy accumulates debt faster than the income needed to service it. Central banks cut rates to keep the machine running; when rates reach zero, they turn to printing money and buying assets. Eventually the debt burden and the cost of servicing it grow faster than the economy itself, and the system has to deleverage through default, austerity, inflation, or some combination of the three.
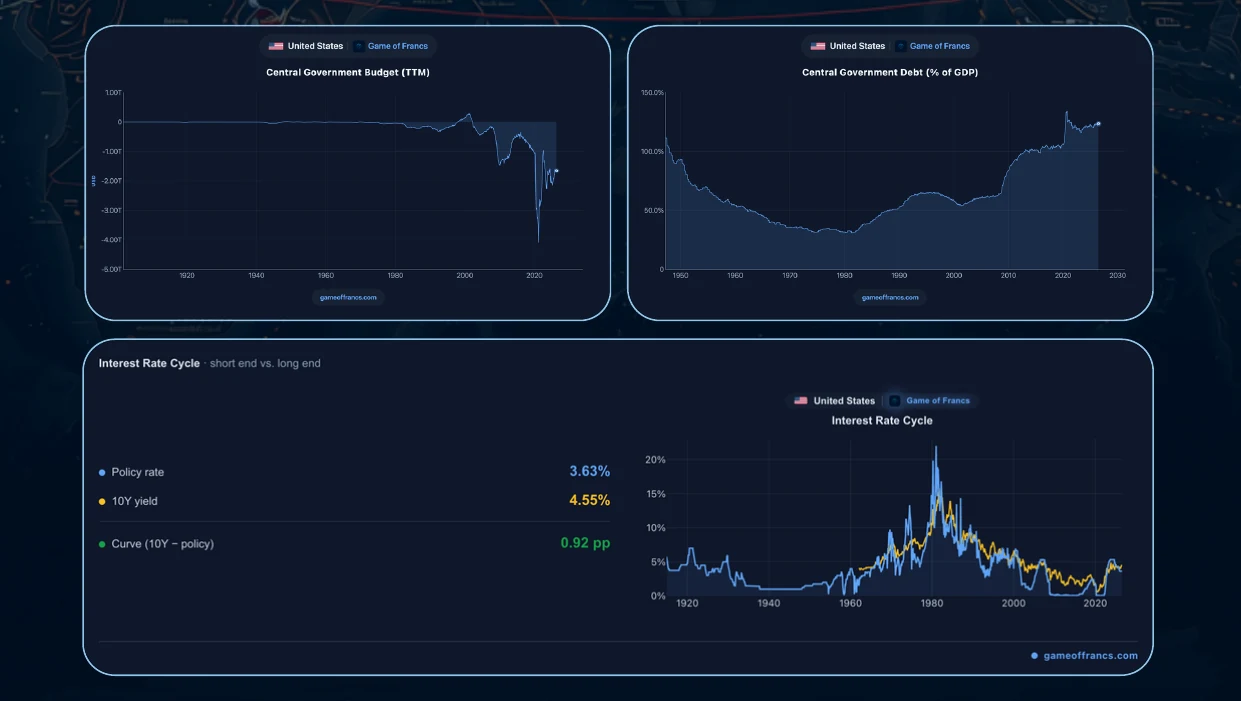
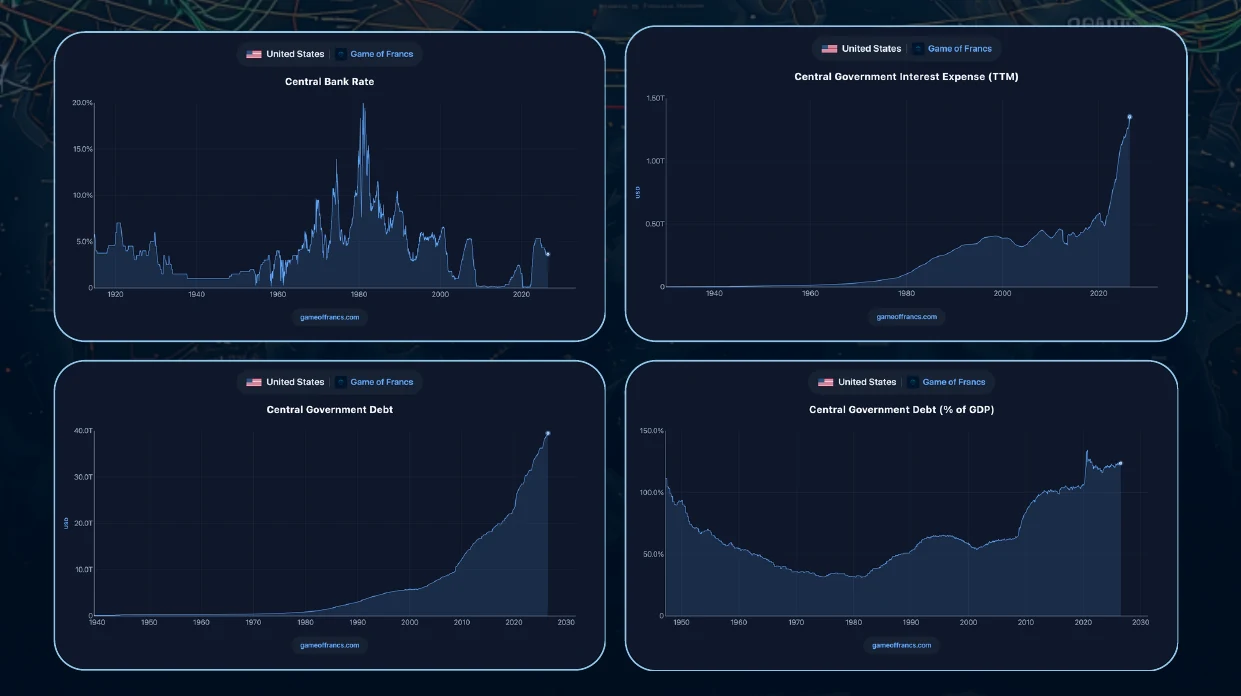
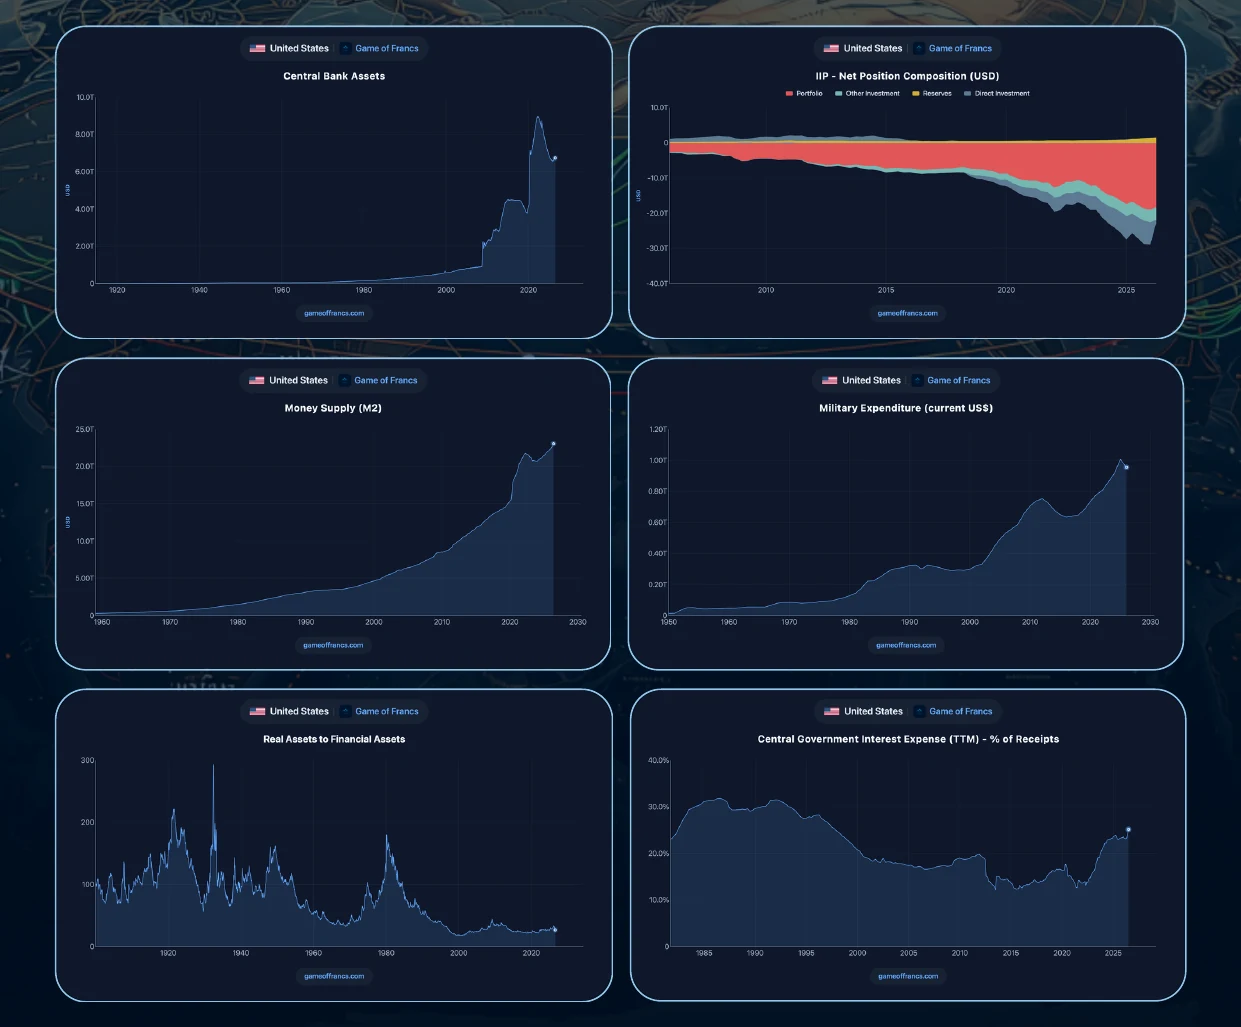
The telltale signature of a cycle in its late stage is a government whose interest bill starts crowding out everything else it wants to do. The United States is now well inside that signature. Gross federal debt reached roughly 123% of GDP at the end of 2025, and debt held by the public crossed 100% of GDP in early 2026, a threshold last breached at the end of the Second World War. More telling than the level is the servicing cost: US net interest ran close to $950 billion in fiscal 2025, approaching the trillion dollar mark and now exceeding what the country spends on national defence. In May 2025, Moody's stripped the US of its final top tier credit rating, the last of the three major agencies to do so.
This is not a prediction of imminent collapse. Deep, liquid markets and a captive base of buyers can sustain a heavy debt load for a long time, as Japan has shown for a quarter of a century. But it is the configuration the framework tells us to watch: rising debt, a climbing interest burden, and a central bank whose balance sheet has become a permanent fixture rather than an emergency tool. Debt strains the machine; the next cycle decides how a society handles the strain.
III. The Internal Cycle: Order and Disorder
Prosperity is rarely shared evenly. As an economy matures and the debt cycle ages, wealth and opportunity gaps tend to widen, and with them the political conflict over how the pie is divided. Dalio tracks this through wealth concentration, political polarisation, and the erosion of the shared rules and institutions that hold a society together. Internal disorder tends to peak late in the long debt cycle, precisely when a slowing economy sharpens the fight over a shrinking surplus.
Inflation is the quiet accelerant. When a government leans on printed money to manage its debts, the cost falls hardest on the young, the wage earner and the saver, who are least able to hold hard assets, while those who already own equities, property and gold are insulated or enriched. A rising cost of living is not only a monetary statistic; it is a distributional event, and distributional events are the raw material of political conflict. This is why economies late in the cycle so often combine strong asset markets with a sour public mood: the aggregate numbers look fine while the median experience deteriorates.
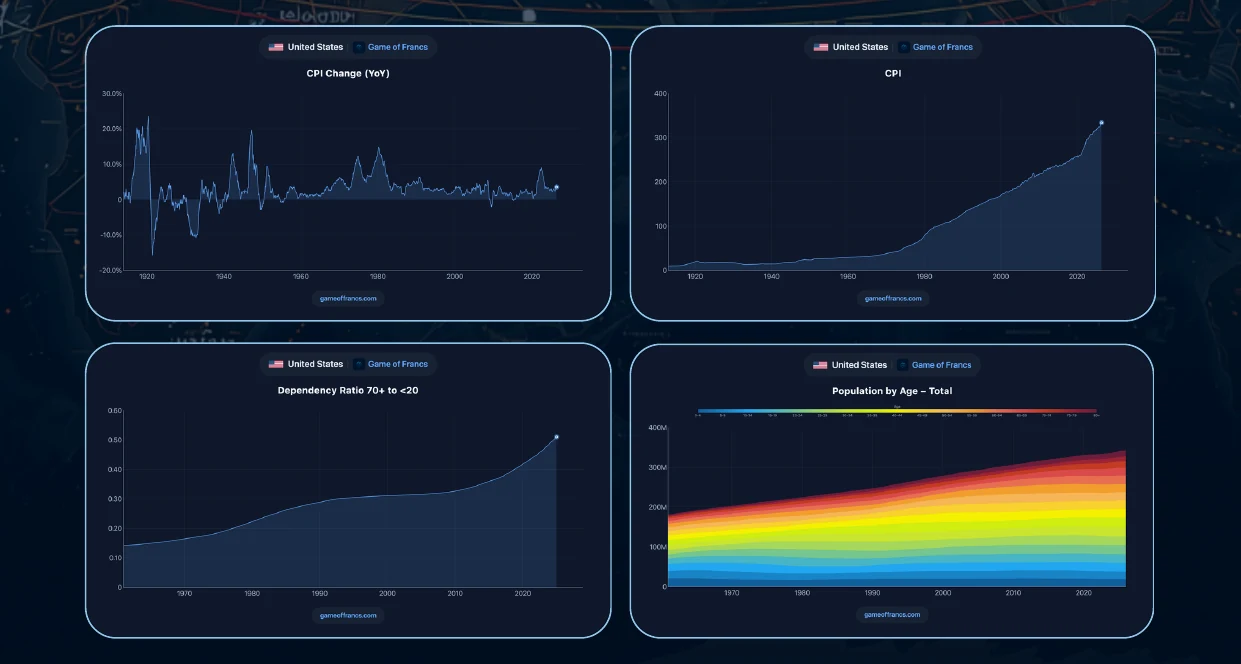
Demographics compound the strain. An ageing population shifts the balance between workers and dependents, loads the pension and health systems, and changes the political arithmetic, which was the theme of our previous edition. Read the age structure, the inflation trajectory and the wealth distribution together and you get a reasonable gauge of internal pressure: how much cohesion a society has left to spend before the rules themselves come up for renegotiation. Internal strength, in turn, is what a country projects, or fails to project, onto the world stage.
IV. The External Cycle: Rise and Fall of Great Powers
The external cycle is the grand one: the rise and fall of great powers and their currencies. A rising power educates, innovates and competes better than its rivals; it wins a growing share of world trade; it builds the military strength to protect its interests; it becomes the world's financial centre; and finally its currency is adopted as the global reserve. Reserve status is the last thing to arrive on the way up, and one of the last to leave on the way down. That lag is what makes decline so easy to deny while it is happening.
History rhymes. The Dutch guilder was the world's reserve currency at the height of the Dutch empire; the British pound took the mantle through the nineteenth century and into the twentieth; the US dollar assumed it at Bretton Woods in 1944 and has held it since. Each transition took decades and was contested, messy, and denied by the incumbent until it was undeniable.
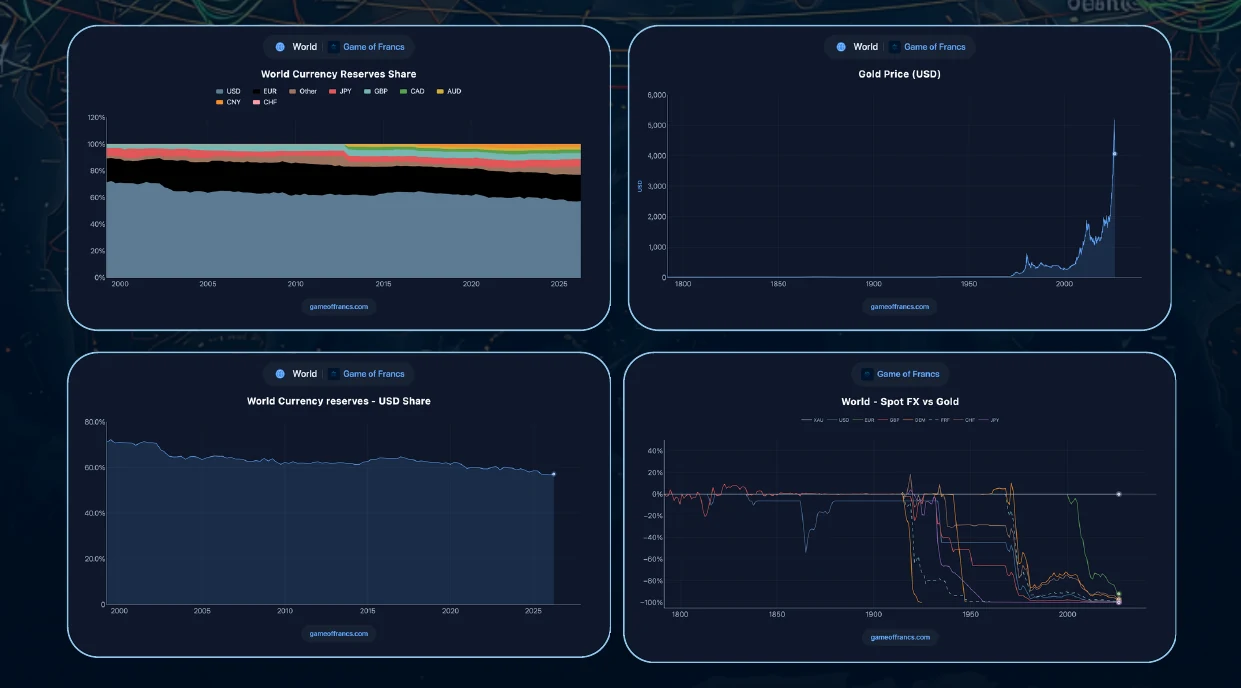
The dollar still dominates, but it is drifting. Its share of allocated global reserves sits around 57%, down from over 70% in the early 2000s and roughly 71% at the start of 1999, according to IMF COFER data. The euro holds near 20%, the renminbi around 2%. Much of the recent quarterly wobble is a valuation effect, driven by currencies moving against the dollar rather than by active selling, so it would be wrong to call this a collapse. But the direction across several decades is unmistakable, and it points toward a more multipolar reserve system rather than a single successor. To judge how far along any power sits, Dalio uses a scorecard.
V. The Eight Measures of Power
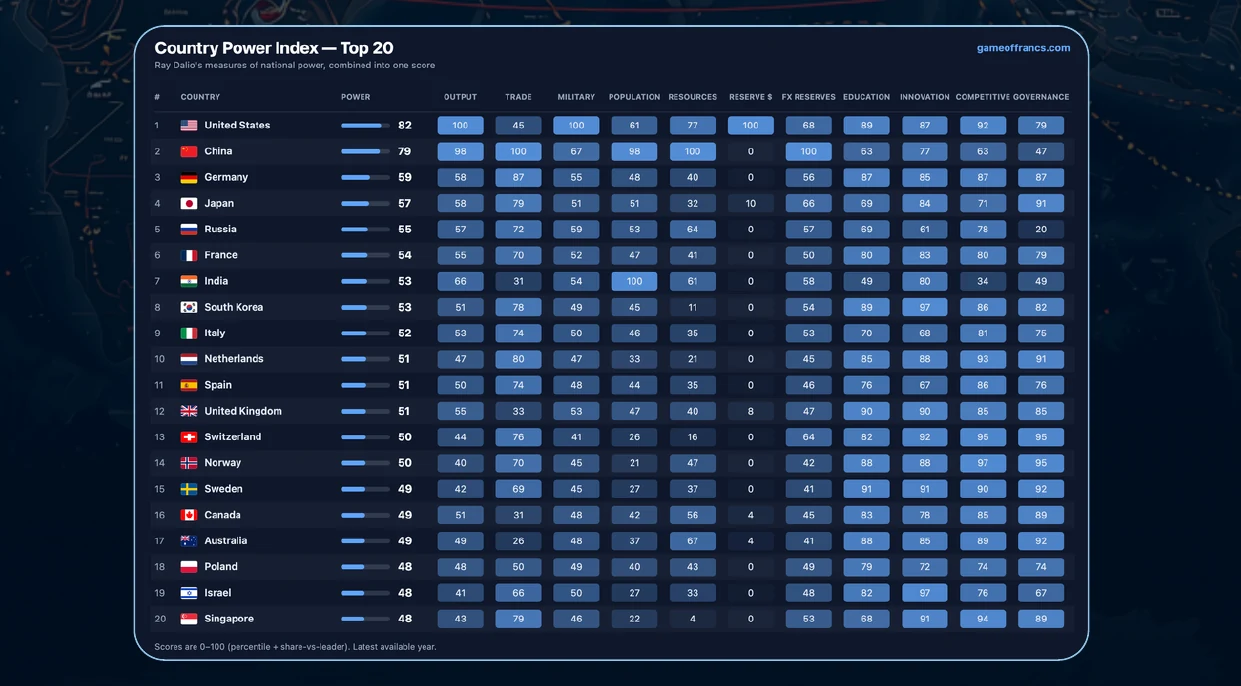
Strip away the specifics and every empire in Dalio's dataset moves through a similar arc, which he tracks with roughly eight measures of power: education, innovation and technology, cost competitiveness, share of world trade, military strength, economic output, status as a financial centre, and reserve currency status.
On the way up these reinforce one another in a virtuous loop. Better education feeds innovation; innovation feeds competitiveness and trade share; trade and output fund a military that protects the whole system; success draws global capital, turning the country into the world's financial hub; and the currency becomes the default store of value. On the way down the same loop runs in reverse, but slowly, and out of sync. A country can lose its educational and competitive edge decades before its currency shows any strain, because reserve status runs on accumulated trust and the absence of a credible alternative.
This is why single indicators mislead. A strong currency can mask a hollowing industrial base; a dominant financial centre can persist long after the innovative lead has migrated elsewhere. The measures peak and trough in a rough sequence, with education and innovation early and financial and reserve status late, so the honest way to read a great power is to watch the whole scorecard at once, not the one metric that still looks flattering. Measured on output alone, the balance has already shifted: on a purchasing power parity basis, China's economy overtook the United States around the middle of the 2010s, even as the US retains the lead in finance, reserve status and military reach. That gap between economic weight and monetary primacy is the space in which the next two decades will be contested.
VI. Where We Are Now: The Debt Signal
So where are we now? Reasonable people disagree on how far along the cycle sits, but several indicators have moved into territory the framework treats as the late stage. Debt is the place to start.
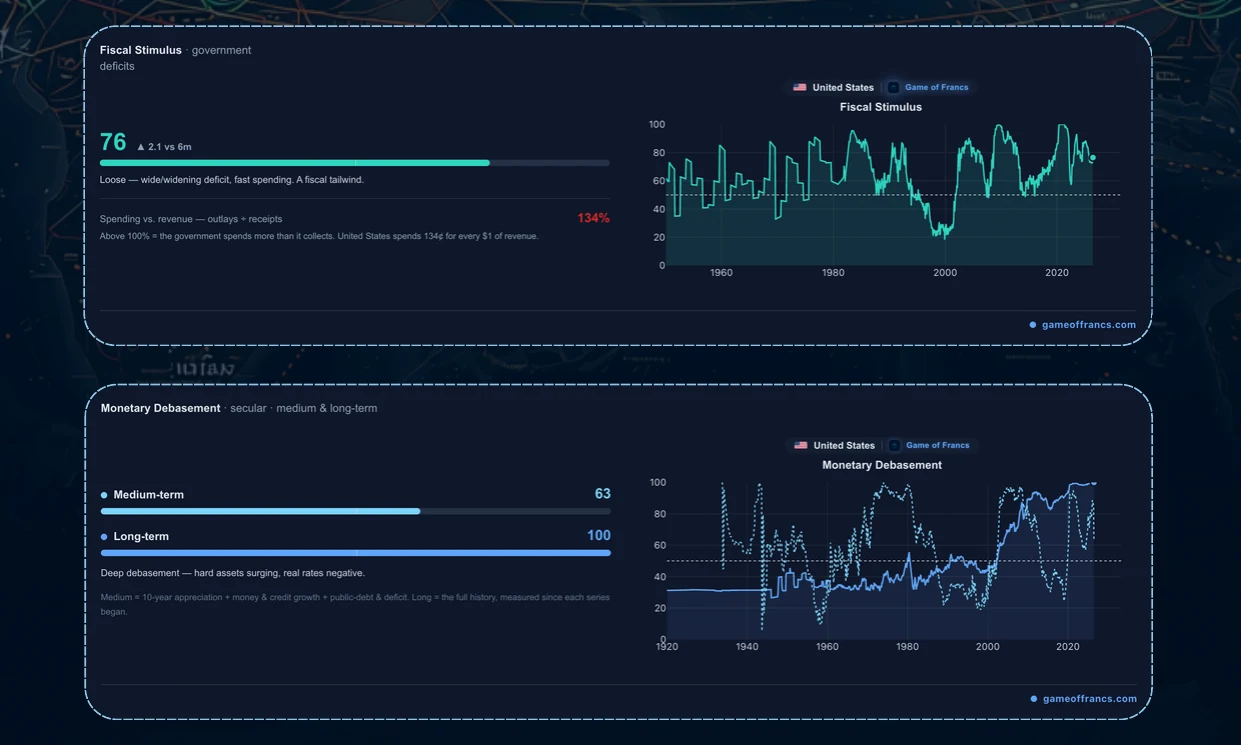
The US fiscal picture, read through the cycle lens, is textbook late stage: public debt above 100% of GDP, gross debt near 123%, an interest bill that has overtaken defence spending, a persistent primary deficit, and a central bank balance sheet that never fully normalised after the last two crises. Each of these on its own is manageable; together, and trending in the same direction, they describe an economy leaning on the monetary and fiscal levers that the framework associates with the top of a long debt cycle rather than the middle.
The mechanism to watch from here is the interaction between debt and rates. As the debt stock grows, even a stable interest rate produces a rising interest bill; if rates rise, the bill compounds faster than the economy can grow, and the government faces the classic choice at the end of a cycle between austerity, default and debasement. Democracies rarely choose austerity or default voluntarily, which is why the historical resolution so often runs through the currency, with inflation quietly reallocating the burden from creditors to the broad public. This is the bridge between the debt cycle and the reserve currency cycle: sustained debasement is precisely what erodes, over decades, the trust that reserve status depends on.
VII. The Reserve Currency Signal
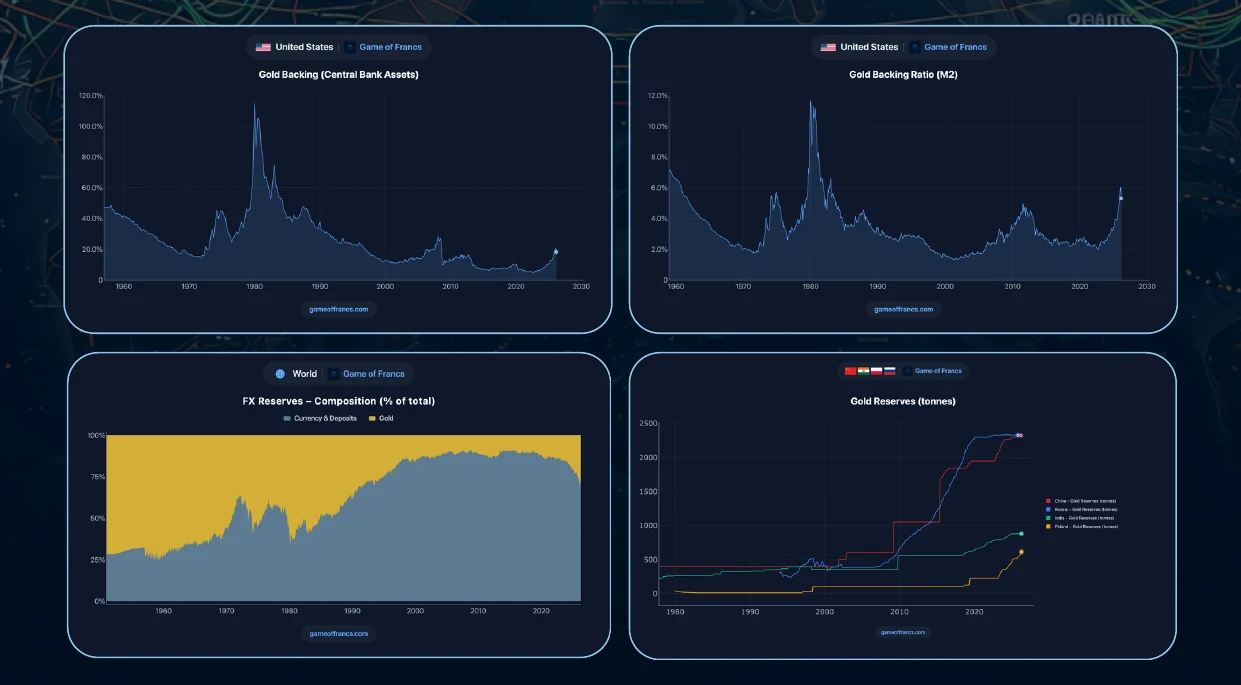
The reserve currency signal tells the same story from the monetary side. The dollar's slide from roughly 71% of allocated reserves in 1999 to around 57% today is gradual, but it is a genuine trend rather than noise, and it coincides with a deliberate diversification by the world's central banks.
The clearest expression of that diversification is gold. Central banks have been accumulating it at an elevated pace for several years, and gold now makes up over 20% of official reserve assets, though a large share of that rise reflects the gold price rather than new tonnes. The behaviour is telling regardless: when the institutions that hold the world's reserves quietly rebuild their gold position, they are hedging the very system they helped build. This is not the same as abandoning the dollar, since most gold buying has not been funded by dollar sales, but it is a vote for optionality in a more uncertain monetary order.
None of this proves the dollar is about to lose its crown. The United States still offers the deepest, most liquid capital markets on earth, an unmatched premium for the rule of law, and no ready substitute exists: the euro lacks a unified fiscal backing, the renminbi lacks open capital markets. Reserve status, remember, is the last thing to go. But consider the pattern the framework tells us to watch: heavy debt, a rising interest burden, monetary accommodation, internal strain, and gradual reserve diversification toward a multipolar system. It is now visibly present, not hypothetical.
VIII. The Challenger and the Multipolar Drift
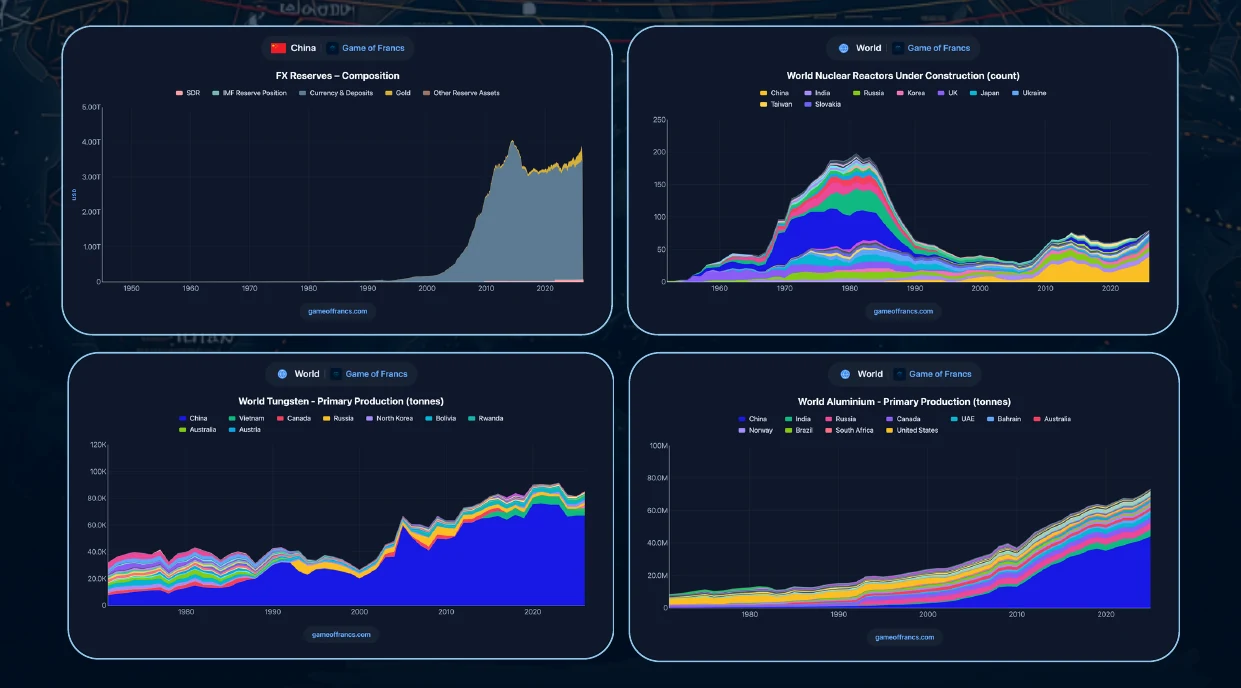
Every falling incumbent has a rising challenger, and today's is China. On output measured at purchasing power parity it has already passed the United States; it is the world's largest trading nation; it is building the financial plumbing to conduct trade outside the dollar's orbit, from its CIPS payment system to expanding currency swap lines and commodity contracts priced in renminbi. None of this makes the renminbi a reserve currency; closed capital markets and limited trust see to that. But it steadily reduces the world's dependence on the dollar at the margin, which is how these transitions always begin.
The contest increasingly runs through the inputs to the next technological era. Whoever controls the lithium, cobalt, nickel, rare earths and processing capacity that underpin the energy and computing transition is accumulating a source of power the framework would recognise instantly. It is the modern equivalent of controlling coal in the nineteenth century or oil in the twentieth. Trade balances, currency crosses such as the dollar against the renminbi, and the production maps for critical minerals are where the external cycle is being redrawn in real time, quarter by quarter.
The transition, if it comes, will not be a single dramatic handover. It will look like what we already see: a slowly falling reserve share, a slowly rising rival, gold rebuilt as a neutral reserve, and payment systems fragmenting into blocs. The framework's warning is specific. The dangerous configuration is high debt met with printed money, internal conflict, and a rising external rival, all at once. That is not a forecast of catastrophe. It is a description of the terrain.
IX. The Wildcards & How to Track the Cycles
Two wildcards sit above all of this. Acts of nature, such as pandemics, droughts and floods, have repeatedly accelerated declines by forcing emergency spending onto balance sheets that were already stretched; COVID added years of debt to every developed economy in a matter of months. Technology cuts the other way: a genuine productivity leap can extend a cycle by lifting the growth rate that services the debt. Whether the current wave of AI and automation becomes that kind of extension, or merely another concentration of wealth that widens the internal gaps, is one of the genuinely open questions of the decade.
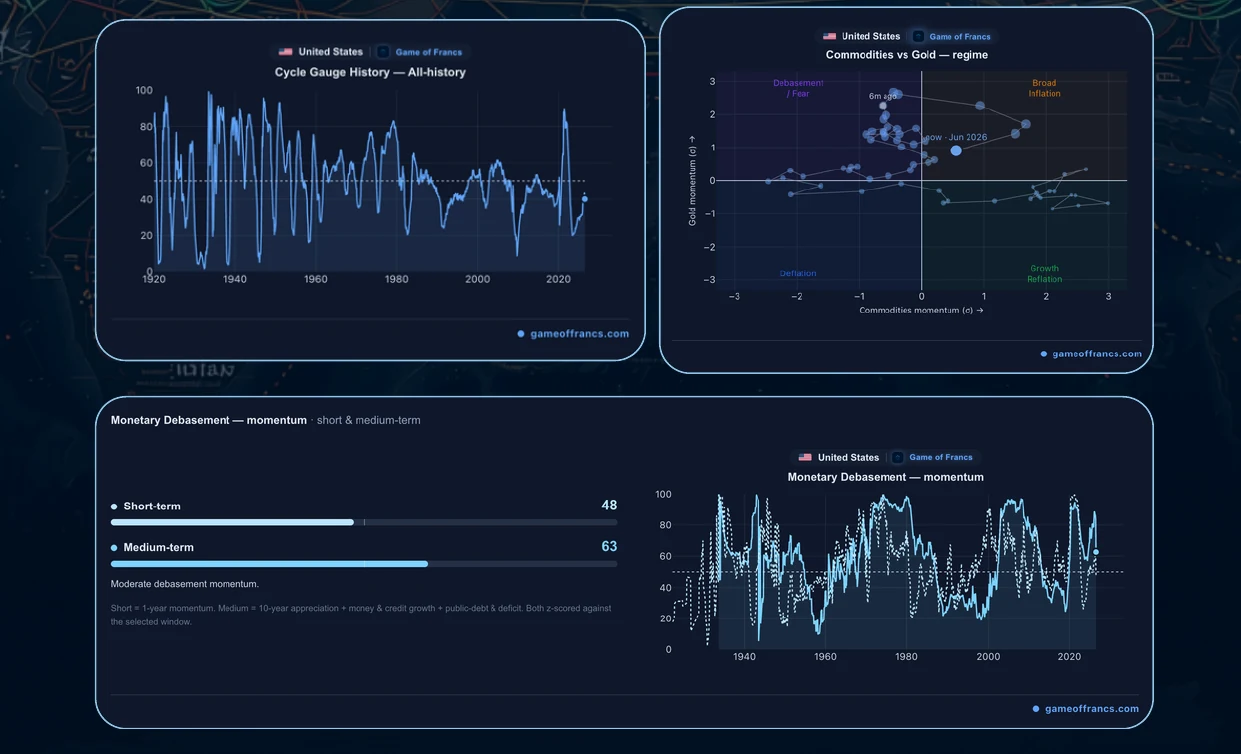
This is where a framework becomes a practice. Each cycle maps onto indicators you can follow directly on Game of Francs. For the debt and money cycle: debt as a share of GDP, the path of interest rates, the shape of the yield curve, the ratio of interest to revenue, and central bank balance sheets, read alongside inflation. For the internal cycle: demographics and old age dependency, the inflation trajectory, and, where available, wealth distribution. For the external cycle: each country's share of global reserves and their currency composition, official gold holdings, trade balances, and the production of the critical minerals that underpin the next technological era.
The aim is not to time the turn, since cycles are probabilistic and the wildcards can bend the path. The aim is to know which era you are standing in, so the next data point lands as a signal instead of a shock.
X. Conclusion: Cycles Are Not Destiny
The Big Cycles are not a trading signal and they are not fate. They are a way of holding the long view steady while the news churns. Empires and currencies rise on education, innovation and trust; they fall on debt, division and complacency. The transition, when it comes, is denied until it is obvious.
The data that tells this story is already public, scattered across dozens of statistical agencies and central banks. Bringing it into one place, so you can see the big picture instead of the next headline, is exactly what this platform is for. The dollar retains its crown, the machine is still turning, and nothing here is inevitable. But the signals worth watching are no longer hypothetical, and now you know where to look.
Get the next article by email
One email when a new piece is published. Nothing else, and one-click unsubscribe from any message.