

#8 - Demographics
The age structure of a population is one of the most powerful and most consistently overlooked forces in the modern economy — quietly shaping pensions, labour markets, asset prices and sovereign debt across the developed world. From Japan, the country that arrived first, to Switzerland's June 2026 referendum on capping its population, this is the fiscal arithmetic of ageing: a pay-as-you-go promise made under demographic assumptions that no longer hold, and the intergenerational transfer every ageing society must eventually confront.
by Game Of Francs Research Team
"Demographics are destiny", or so the saying goes. In reality, the age structure of a population is one of the most powerful and most consistently overlooked variables shaping the modern economy and society as a whole. It rarely dominates the policy debate. But it quietly underlies many of the pension pressures, labour shortages, immigration controversies, and sovereign debt trajectories of the past half-century. Switzerland put it to a vote in June 2026, and 55% chose to not cap the population.
I. The Invisible Force That Shapes Everything
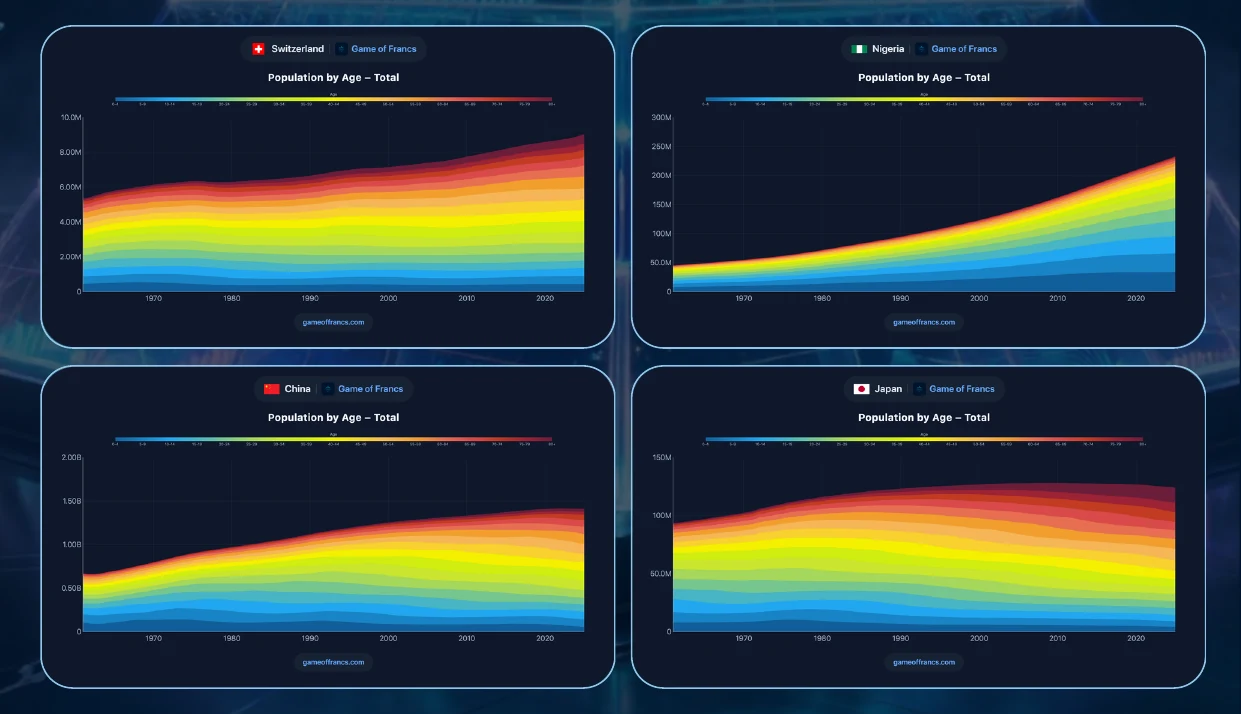
Among the forces shaping the modern economy, few are as powerful or as consistently overlooked as the age structure of the population. Unlike interest rates, fiscal policy, or trade flows — which dominate the daily conversation of economists and market participants — demographics operates on a timescale of decades, making it easy to defer, discount, and ultimately ignore until its consequences become impossible to avoid.
When the age structure is favourable — when a large cohort of young workers is entering the labour force and a small cohort of elderly is drawing down pensions — an economy enjoys what economists call the demographic dividend: rising output per capita, expanding savings, declining dependency ratios, and the fiscal headroom to make promises that future governments will be expected to keep. Much of the prosperity of the postwar decades was built on precisely this tailwind.
When the age structure turns — when the large cohort ages into retirement, the fertility rate has been falling for decades, and the ratio of workers to pensioners begins its long structural decline — the dividend becomes a headwind. Every pension system designed around a three-to-one worker-to-retiree ratio confronts a ratio of two-to-one, then one-and-a-half, then one. Every promise made during the favourable years must now be honoured from a more constrained productive base.
This demographic shift is one of the defining structural stories of the 21st century. It does not operate alone — technology, monetary policy, trade, and geopolitics all shape economic outcomes simultaneously. But it provides the slow-moving backdrop against which those forces play out. Switzerland voted on one dimension of it last Sunday. The vote was framed as an immigration debate. At its core, it was a question about which side of the demographic ledger the country wants to be on.

II. The Demographic Transition: How We Got Here
To understand the current predicament, it is necessary to understand the transition that produced it — the most consequential demographic shift in recorded history, playing out across the developed world across the span of roughly sixty years.
The postwar period — roughly 1945 to 1975 — was, in every developed economy, an era of extraordinarily favourable demographics. Birth rates were elevated by the baby boom. Life expectancy was rising but had not yet extended into the decades of expensive medical dependency that characterise the very old. The labour force was expanding rapidly, driven by the large cohort of young adults and the mass entry of women into formal employment. The ratio of workers to retirees was high and rising. Governments could design generous pension systems, universal healthcare, and expanding welfare states with genuine financial sustainability.
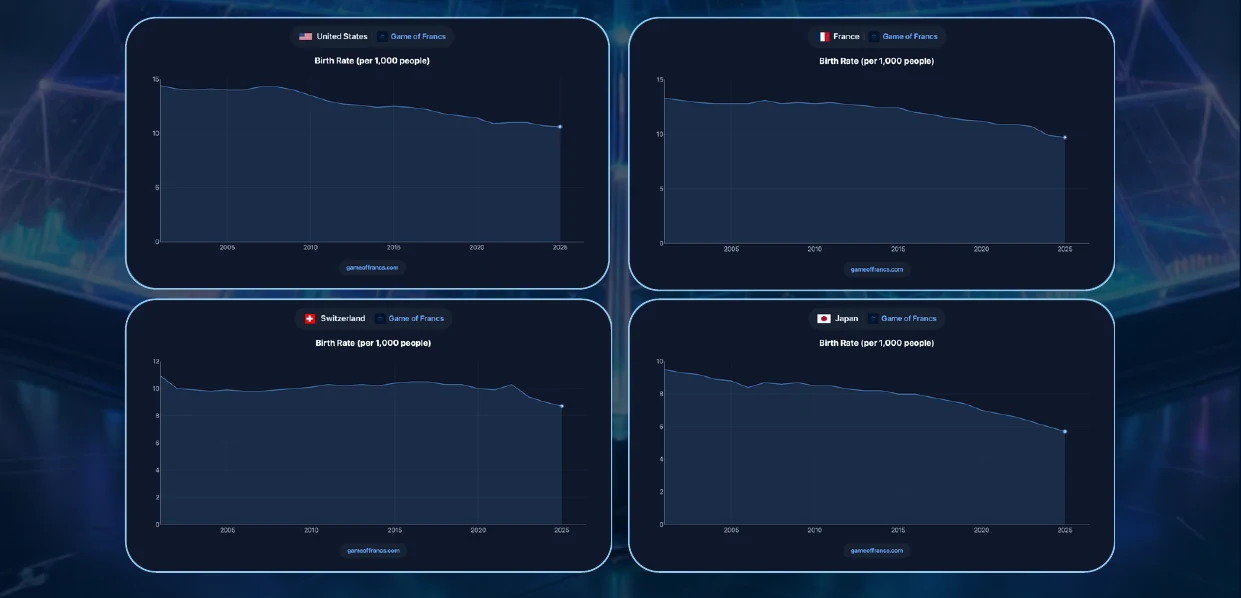
The fertility rate began its long structural decline in most developed countries in the mid-1960s. The causes are well-documented and deeply structural: urbanisation, rising female education and labour market participation, the availability of contraception, and the progressive shift from agricultural to service economies. By the 1970s, most Western European countries had fertility rates below the replacement level of approximately 2.1 children per woman. By the 1980s, the decline had become self-reinforcing: smaller cohorts of childbearing adults produced even smaller cohorts of children, creating a demographic contraction that compounds across generations.
The reckoning has arrived on a schedule that was entirely predictable from the fertility data of the 1960s and 1970s. The baby boomers began retiring in large numbers in the 2010s. The cohorts entering the labour force to replace them are systematically smaller. The pension systems, the healthcare systems, and the sovereign debt trajectories of every developed country that built its welfare state during the demographic dividend are now confronting the bill.
III. Japan: The Country That Arrived First
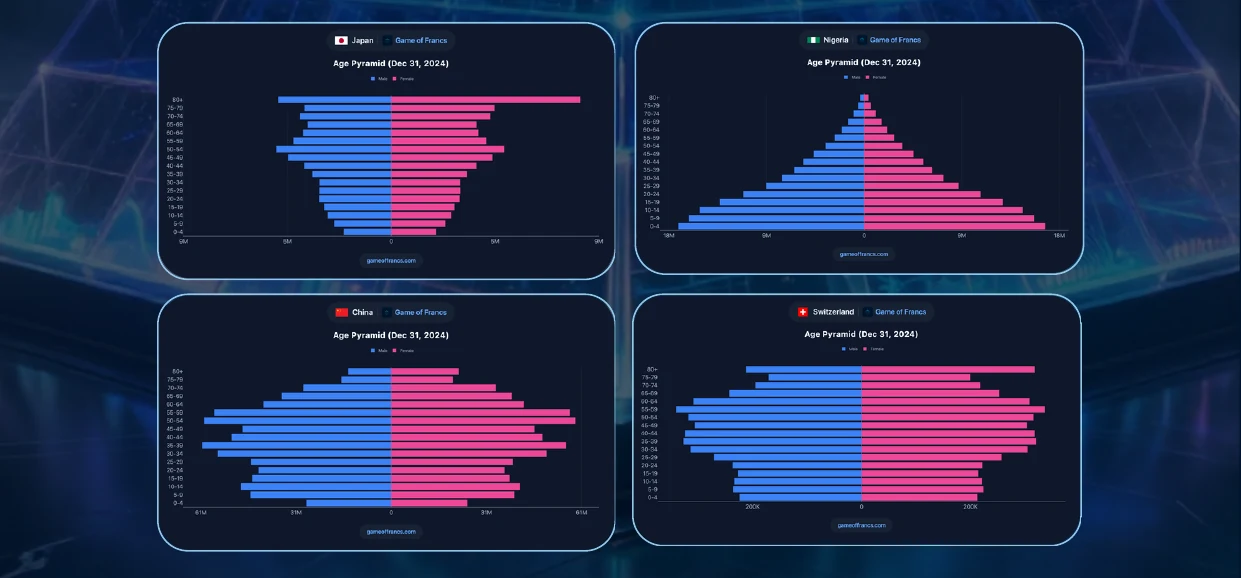
Japan is the paradigmatic case study of demographic transition taken to its logical extreme — the economy that got there first and has been providing the rest of the developed world with a preview of its own future for thirty years.
Japan's total fertility rate fell below the replacement level in 1974. It has not recovered since, averaging approximately 1.3 children per woman over the past two decades. Japan has historically maintained one of the most restrictive immigration policies among major developed economies, with foreign-born residents comprising less than 3% of the population through most of the postwar period.
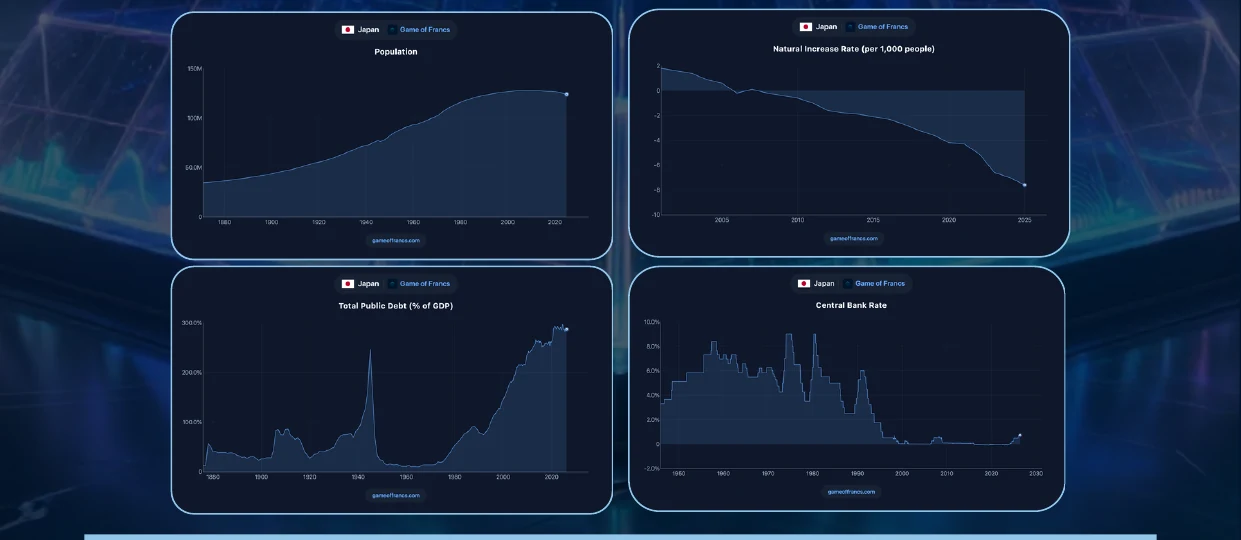
The consequence is a population that peaked in 2008 at approximately 128 million and has been declining since. Japan's population is now below 125 million and projected, under current assumptions, to reach 100 million by 2055 and continue declining thereafter. The working-age population has been shrinking since the mid-1990s. Japan now has approximately 2.1 workers for every retiree — a ratio that will fall below 1.5 within two decades.
The fiscal consequences are equally severe. Japan's government debt-to-GDP ratio exceeds 260% — the highest of any major economy in recorded history. The primary driver is not fiscal profligacy in the conventional sense. It is the structural mismatch between the promises made during the demographic dividend and the revenue base available to fund them as the ratio of workers to retirees has declined. Japan has, for thirty years, been borrowing to fund the gap between what it promised its ageing population and what its shrinking working-age population can fiscally support.
The Bank of Japan's extraordinary monetary interventions — near-zero interest rates since 1999, QE from 2001, yield curve control from 2016 — are not primarily monetary policy tools. They are demographic policy tools: mechanisms for suppressing the cost of debt that the fiscal arithmetic of an ageing society makes otherwise unmanageable.
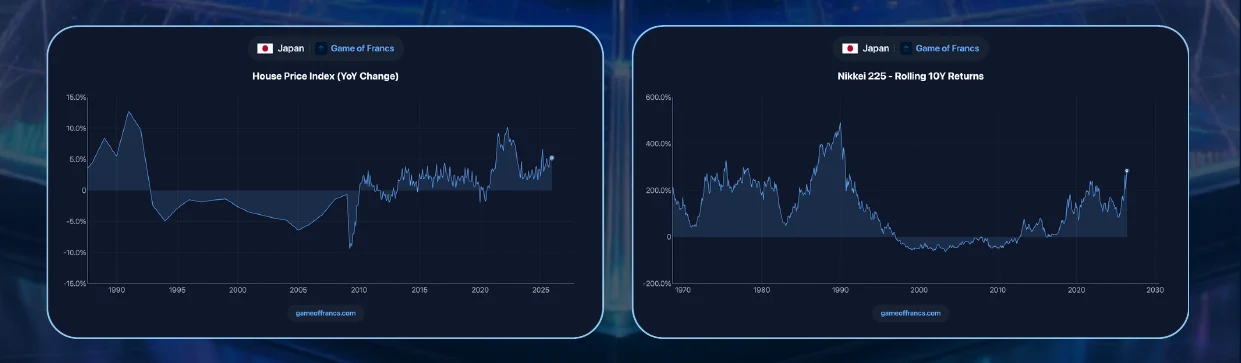
The asset price dynamics of Japan's demographic transition are equally instructive. Japanese residential real estate outside of a handful of growing cities has been in generational decline since the early 1990s — not because of regulation or financialisation, but because the population of potential buyers is shrinking faster than the housing stock. There are now approximately 9 million empty houses across Japan. The ratio of houses to households will only worsen as the population continues to decline.
The labour market tells the same story from a different angle. Japan has the lowest unemployment rate of any major developed economy — consistently below 3% — but not because its economy is generating exceptional demand for labour. It is because the supply of labour is structurally constrained by a shrinking working-age population. Labour scarcity in Japan is not a product of economic vigour. It is a product of demographic attrition.
Japan is not a monetary anomaly. It is a demographic anomaly — and every country currently experiencing declining fertility is following the same path, with a lag of ten to thirty years. Germany, Italy, South Korea, and Spain are all on trajectories that converge, within the lifetimes of people currently in their forties, toward the demographic conditions that Japan has been experiencing since the 1990s.
The Japanese experience is a complete, three-decade-long demonstration of what happens to an economy when the demographic transition runs its full course without a compensating inflow of working-age population: debt accumulates, monetary policy becomes structurally accommodative, real estate deflates outside major cities, and the labour force shrinks despite full employment. It is the future that Switzerland was debating last Sunday.

IV. The Swiss Referendum: Democracy Confronts Arithmetic
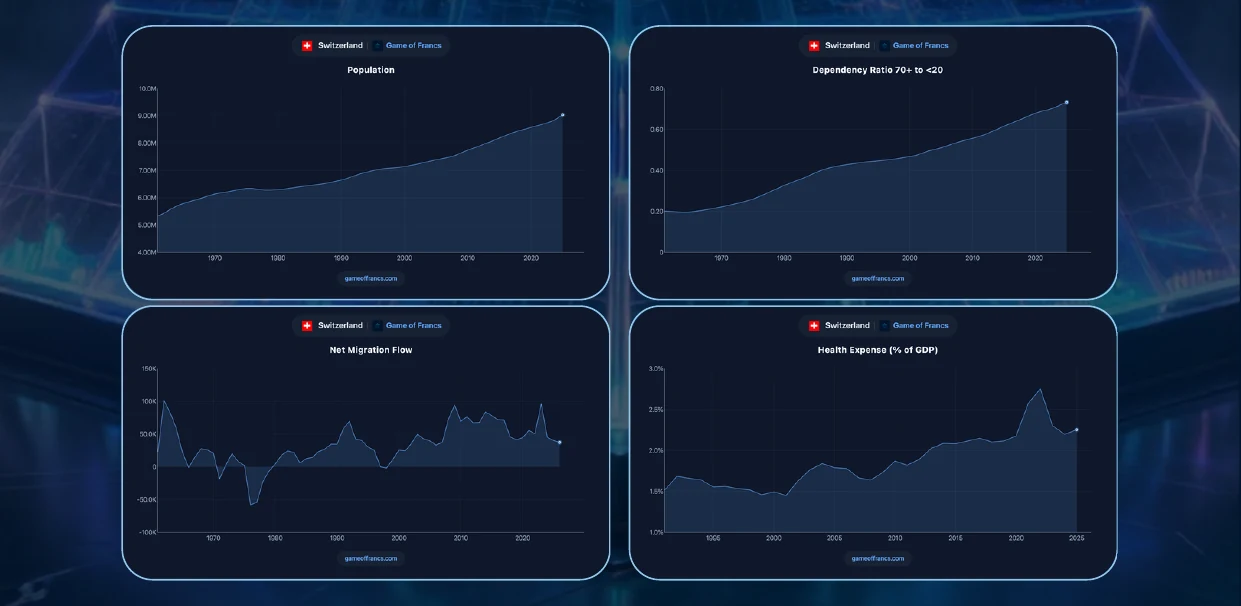
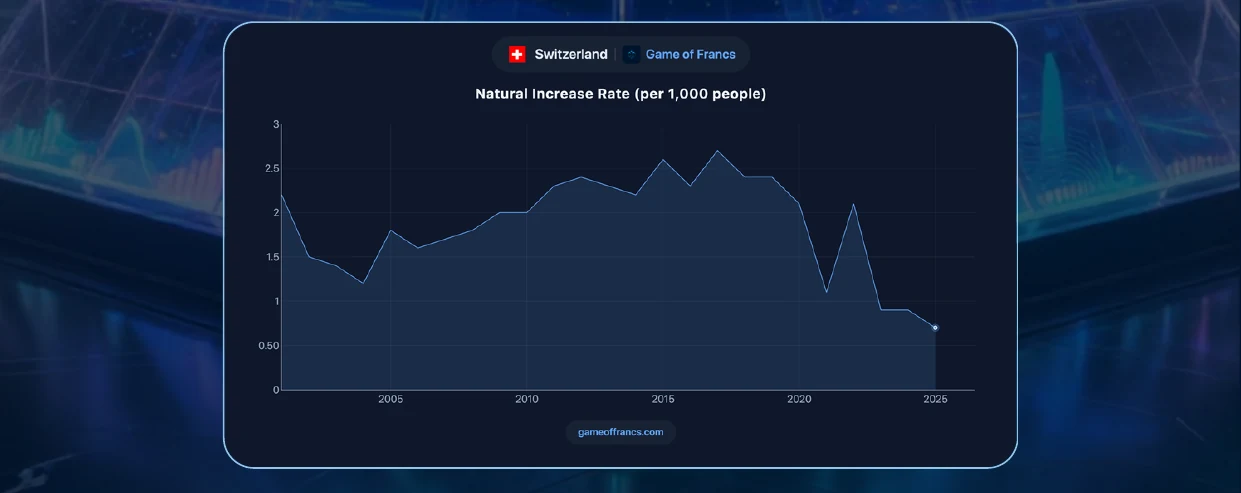
For the first time in Switzerland's history, the country recorded more people over 65 than under 20. The population stood at 9.1 million at the end of 2025, having grown 10% in the preceding decade and 23% since the agreement on free movement with the EU came into force in 2002. Foreign-born residents now comprise approximately 27% of the total, most from EU countries.
Against this backdrop, the Swiss People's Party launched the “No to Ten Million Switzerlandˮ initiative — a proposal to cap Switzerlandʼs permanent resident population at 10 million by 2050, triggering automatic immigration restrictions if the population reached 9.5 million before that date.
On Sunday June 14, Swiss voters rejected the initiative by 55% to 45%. The rejection was most decisive in the cities: 73.5% against in Basel-City, 67.3% in Neuchâtel, 65.4% in Geneva. Small rural cantons voted in favour, with Appenzell Innerrhodes at 65.9% yes. The geographic pattern is analytically revealing: urban areas, where immigrant workers are economically integrated and the fiscal logic of demographic replenishment is most directly observable, voted to maintain openness. Rural areas — where population decline is already visible in shuttered schools and vacant properties — voted to restrict the immigration that might slow that decline.
The fiscal argument against the initiative was grounded in data. A 2023 Federal Social Insurance Office study found that immigration benefits both the AVS pension system and disability insurance — foreign residents contribute more in payroll taxes than they receive in benefits, being on average younger and economically active. In 2025, AVS revenues exceeded expenditures by CHF 1.8 billion, with the overall surplus reaching CHF 4.4 billion including investment income.
The referendum was, at its core, a vote on whether to accelerate the Japanese scenario or delay it. The majority voted correctly from a fiscal perspective. But delay is not resolution.
V. The Global Demographic Map
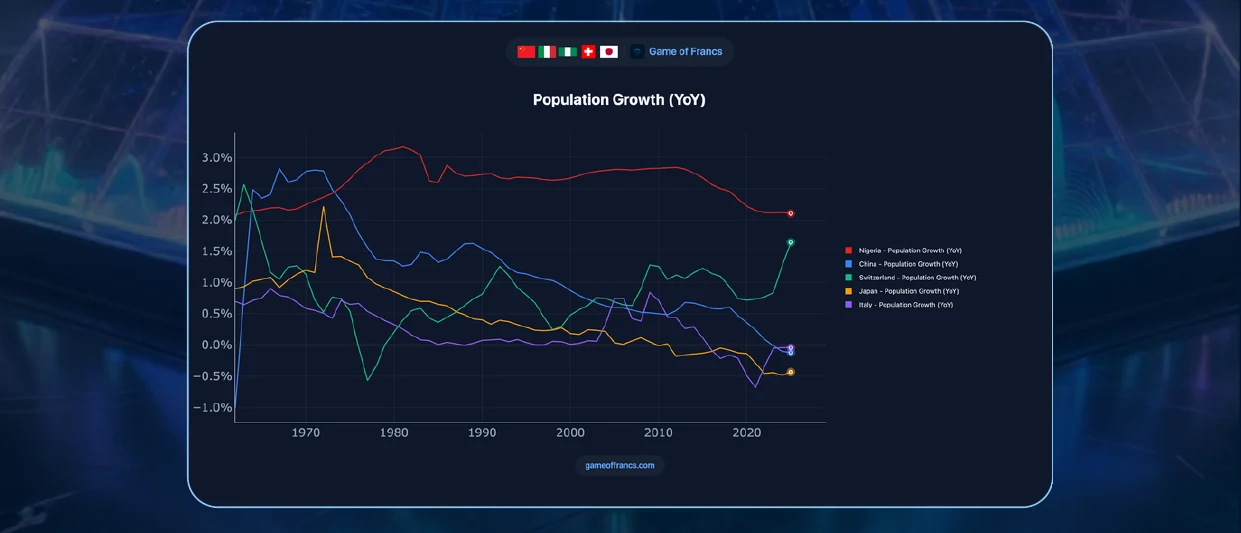
Switzerland and Japan are not exceptions. They are the leading edge of a demographic transformation encompassing the entire developed world and beginning to reach into emerging economies that had, until recently, been characterised by youthful populations and demographic dividends of their own.
In Europe, every major economy is experiencing below-replacement fertility. Germany's total fertility rate stands at approximately 1.5. Italy's at 1.2 — among the lowest in the world. Spain's at 1.1. A country with a fertility rate of 1.3 loses approximately 38% of its population per generation — a contraction that, extended across three or four generations, transforms the physical and economic landscape of a nation.
China, which spent three decades suppressing fertility through its one-child policy, is now confronting the consequences with a speed and severity that is structurally unprecedented. China's working-age population peaked around 2012 and has been declining since. Its total fertility rate has fallen to approximately 1.0 — below even Japan's. China will face, within fifteen to twenty years, a demographic transition of Japanese severity but at Chinese scale: a country of 1.4 billion beginning a structural population decline while still at a middle-income level of economic development.
India remains, for now, an exception — with a fertility rate still modestly above replacement. But India's rate has been declining rapidly and is projected to fall below replacement within a decade.
Sub-Saharan Africa remains the demographic outlier: sustained high fertility rates producing population growth of extraordinary scale, from approximately 1.5 billion today to over 4 billion by 2100 under median fertility assumptions. This population represents either the most significant potential labour force expansion of the 21st century or the most significant source of migration pressure in modern history — depending on whether the economic infrastructure required to absorb it is built.
VI. The Fiscal Arithmetic of Ageing
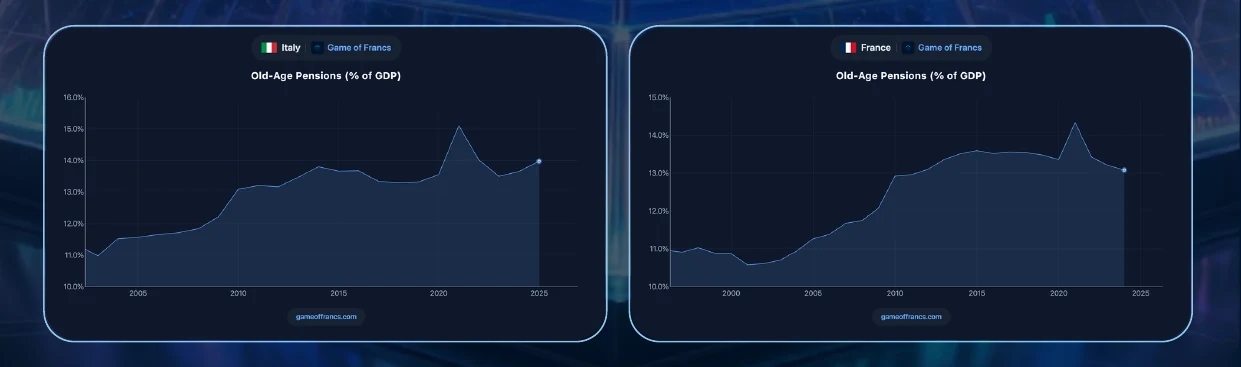
The pension systems of the developed world were designed, almost universally, around demographic assumptions that no longer hold. They are pay-as-you-go systems: current workers fund current pensioners, with the expectation that future workers will fund the contributors of today. This architecture is financially sustainable only as long as the ratio of workers to pensioners remains approximately constant.
It is not remaining constant. In 1950, the global old-age dependency ratio was approximately 1 elderly person for every 12 workers. Today it stands at roughly 1 in 7 globally, but 1 in 4 in Europe and 1 in 3 in Japan. The European Commission estimates that age-related public spending will consume between 25% and 35% of GDP in most European countries by 2050, up from 20-25% today.
The response options available to governments confronting this arithmetic are limited and each carries significant political cost. Raising the retirement age is actuarially correct but deeply unpopular. Switzerland voted on this in March 2024, rejecting an initiative to raise the retirement age while simultaneously approving a 13th month of pension payment — directly deepening the fiscal imbalance the demographic transition is already creating.
Reducing benefit levels achieves the same actuarial correction through a different route — equally unpopular and disproportionately affecting those with no private savings. Increasing contribution rates raises the tax burden on the working-age population that is already smaller than the system was designed to accommodate.
Immigration provides a partial offset — importing the working-age population that native-born fertility has failed to produce. But immigration is not a long-run solution to a demographic structural deficit. Immigrants age too. The fertility rates of second-generation immigrants converge, within a generation, toward the native-born rate. And the political sustainability of the immigration levels required to fully offset demographic decline — as the Swiss referendum illustrates even in its rejection of a cap — is demonstrably limited.
VII. The Asset Price Dimension
The connection between demographics and asset prices is one of the most important and least widely discussed relationships in long-run investment analysis.
The standard life-cycle savings model predicts that households accumulate savings during their working years and draw them down during retirement. The aggregate savings rate of an economy is therefore determined by the age structure of the population: high when the working-age cohort is large relative to the retired cohort, low when the balance shifts in the other direction.
This framework implies that the extraordinary asset price inflation of the 1980s and 1990s was, in part, a demographic phenomenon: the large baby boom cohort entering its peak savings years simultaneously, channelling income into pension funds, equities, and real estate at a scale that drove valuations well above historical norms. The equity bull market of that era was not only a product of monetary policy and productivity growth. It was, in part, a product of a demographic wave pushing an unprecedented volume of savings into financial markets.
The demographic reversal implies the mirror image. As the baby boom cohort moves from net accumulation to net decumulation — selling financial assets to fund consumption in retirement — the demand for equities, bonds, and real estate that their savings generated will be replaced by supply.
Japan's equity market peaked in 1989 and has only recently surpassed that peak, after a thirty-five-year compression. Japanese residential real estate outside major cities has fallen in real terms for three decades. The baseline arithmetic is the same in every ageing developed economy: shrinking cohorts of workers generating smaller aggregate savings, meeting growing cohorts of retirees generating aggregate asset liquidation. The direction of the demographic pressure on long-run asset prices is unambiguous.
VIII. The Political Economy of Denial
If the demographic arithmetic is this clear, and if the consequences are this severe, why has the policy response been so inadequate?
The answer lies in the political economy of democratic systems confronting long-horizon costs. Pension promises cost nothing at the moment they are made. The politician who commits to a generous retirement age, a 13th monthly pension payment, or a benefit formula that exceeds actuarial sustainability captures the political benefit immediately — in the form of grateful voters at the next election — while deferring the fiscal cost to a future government, a future tax base, and a future electorate that did not exist when the promise was made.
The demographic arithmetic is perfectly transparent to anyone willing to examine the fertility data and standard actuarial models of any OECD pension system. The Federal Social Insurance Office in Switzerland publishes it. The European Commission publishes its Ageing Reports every three years. The OECD publishes Pensions at a Glance annually. The Bank of Japan has been confronting the fiscal consequences of its demographic transition for thirty years in full public view.
What is deliberately obscured in political discourse is the specific sacrifice that addressing the arithmetic honestly would require: who bears the cost of adjusting pension promises made under demographic assumptions that no longer hold. Every mechanism for closing the demographic fiscal gap involves a transfer of wealth between generations. Raising the retirement age transfers cost to current middle-aged workers. Reducing benefits transfers cost to current pensioners. Raising contribution rates transfers cost to current workers. Restricting immigration transfers cost to the future.
The Swiss vote on June 14 resolved one specific question correctly. But it left unresolved the underlying question that the cap initiative was, however clumsily, pointing at: how does any ageing developed society sustainably fund the promises it has made to a rapidly growing retired population from a resource base that is not growing commensurately?
IX. Conclusion: The Arithmetic Does Not Negotiate
Unlike interest rates, fiscal policy, or geopolitical events, the demographic variable does not bend to institutional decisions or policy announcements. Its trajectory is largely set decades in advance by the fertility decisions of people who are not yet parents and the mortality trajectories of populations who are already old. This is precisely why it tends to be underweighted in short-horizon policy frameworks and financial models — it moves too slowly to generate urgency, but its cumulative effect is profound.
The developed world has known, with reasonable precision, for at least thirty years that this transition was coming. Japan has been demonstrating its fiscal and economic consequences since the early 1990s — not as the single cause of its challenges, but as a major structural constraint amplifying every other difficulty it faces. The Swiss referendum last Sunday crystallised, in the context of one small, wealthy, and functional democracy, the fundamental tension that every ageing society must eventually address: between the political desire to slow change and the fiscal logic of the working-age population that change produces.
The 55% who voted against the population cap made the fiscally coherent choice. The 45% who voted for it were not irrational — they were expressing a legitimate concern about the pace and character of social change that fiscal arithmetic alone does not address.
Switzerland, by rejecting the cap, bought itself some time. But demographic trends do not wait for consensus. They compound quietly, and they tend to surface eventually — not at the ballot box, but in actuarial tables, pension fund reports, and healthcare cost projections.
The age structure of a population is not destiny. But it is one of the most powerful constraints within which every other policy must operate. And it remains, for most investors, policymakers, and citizens, one of the most underappreciated forces in the room.
Get the next article by email
One email when a new piece is published. Nothing else, and one-click unsubscribe from any message.