
#13 - Can Anyone Still Afford a House?
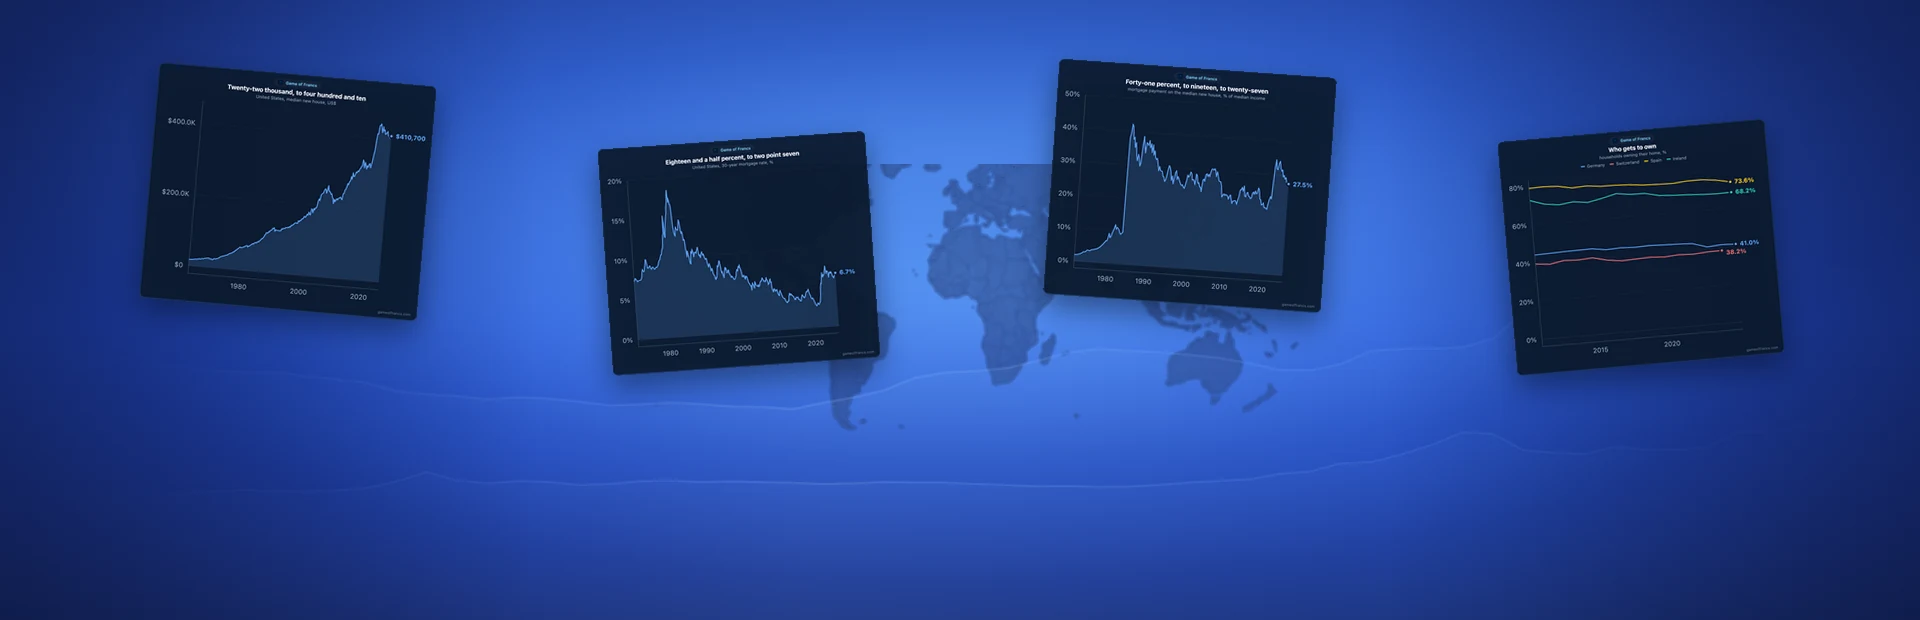
In 1970 the typical new house in America sold for $22,600. Today it sells for $410,700 — and yet the monthly payment on it takes a smaller share of a family's income than it did in 1984. Both are true, and the distance between them is the whole story of housing: what you pay for a home has less to do with its price than with the price of the money you borrow to buy it.
by Game Of Francs Research Team
I. The Price Everyone Sees
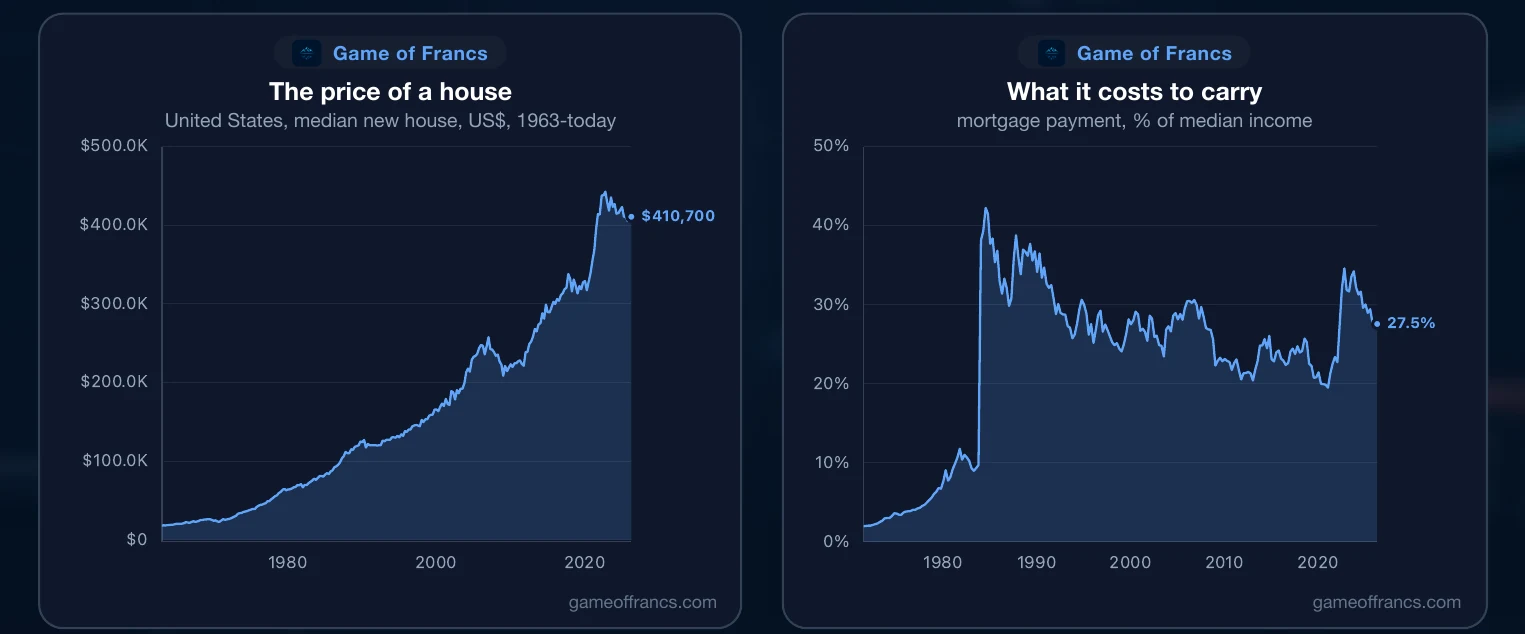
Start with the number on the sign, because it is the only one most people ever see. The median new American house cost $22,600 in 1970. It passed $100,000 in the mid-1980s, $200,000 in 2004, and peaked at $442,600 at the end of 2022. It sells for $410,700 today.
The rise is not an American peculiarity. Measured across the countries that publish a comparable index, house prices have doubled since 2007. Not in one market, not in one bubble: a global index that fell for barely a year after the financial crisis and has risen in almost every quarter since.
That is the fact everyone agrees on, and it is where most of the argument stops. It should not, because a price is a number in the money of its day, and the money of 1970 is not the money of today.
II. What Inflation Explains, and What It Does Not
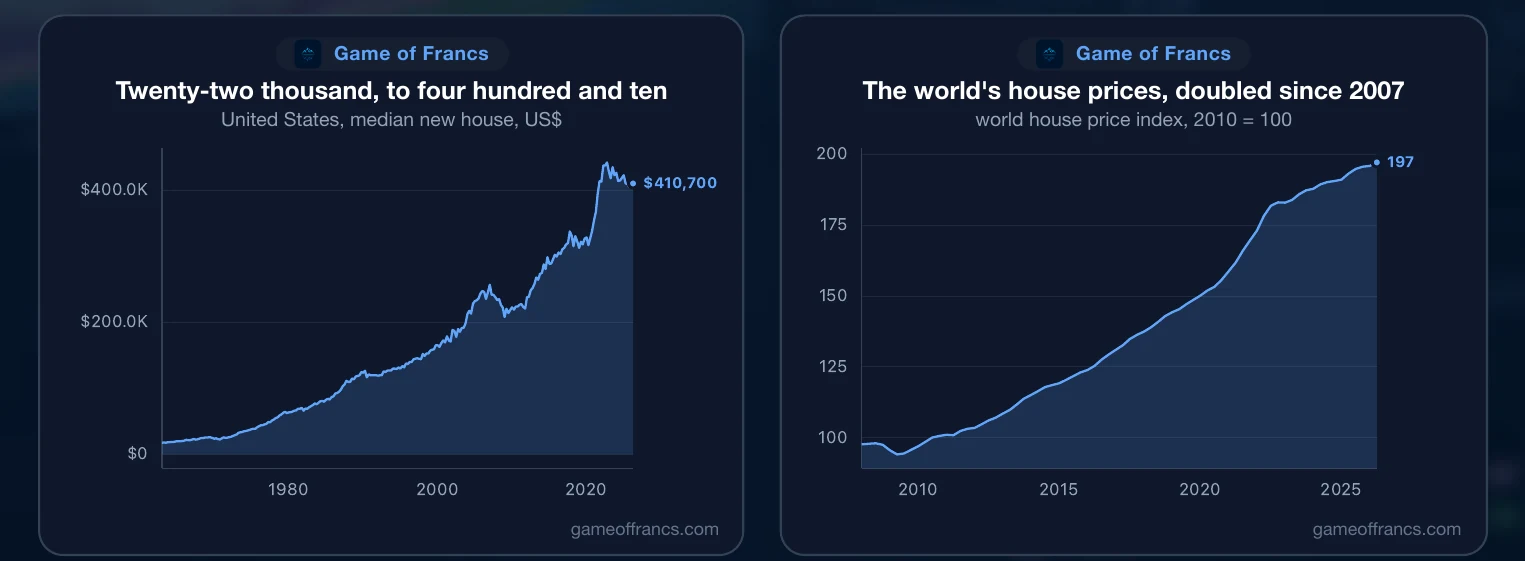
Take inflation out and the single story splits into several. In Australia and New Zealand, house prices after inflation are more than four times what they were in 1970. In Switzerland they are a little over twice. In the United States they are almost exactly twice: a hundredfold rise in the nominal price since 1890, four fifths of it since 1990.
Then there is Japan, where real house prices are a third below where they stood in 1991. Thirty-four years, in the third-largest economy on earth, and the asset that is supposed to be the safest store of household wealth has not recovered its peak.
Same asset, same half-century, opposite outcomes. Whatever made housing expensive, it was not gravity.
III. Against What People Earn
The honest comparison is not price against prices. It is price against pay.
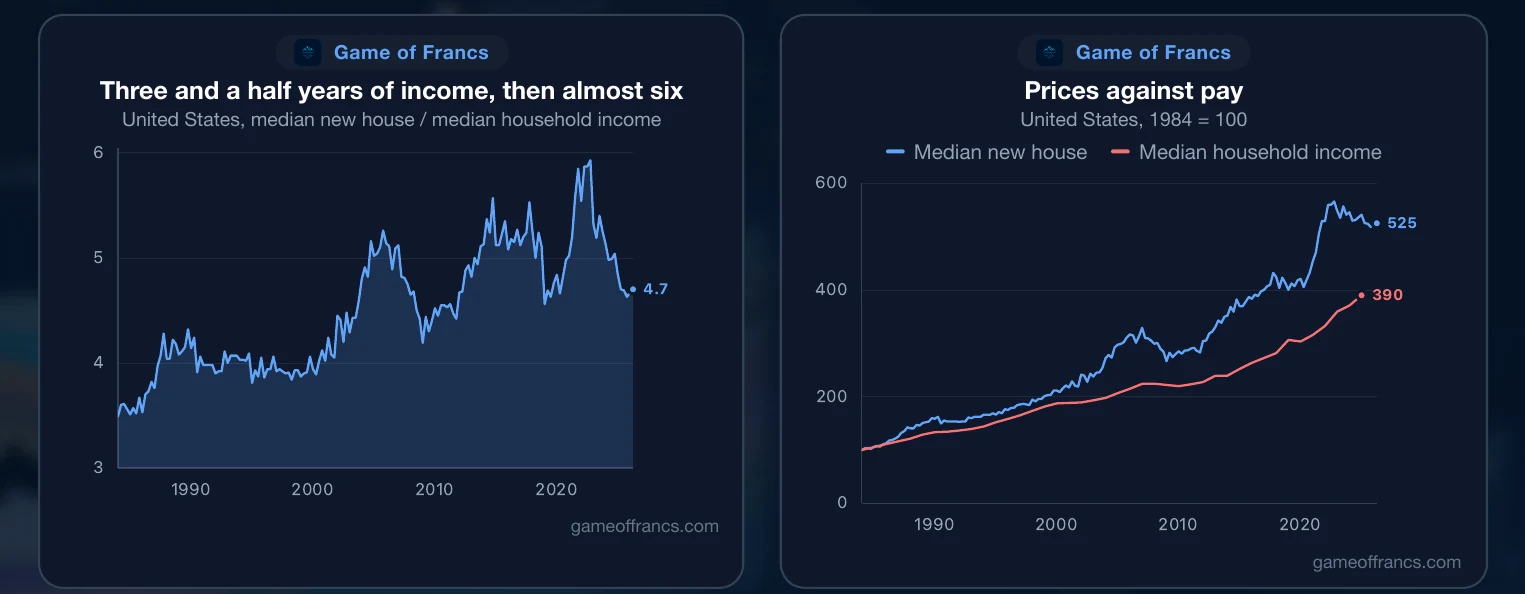
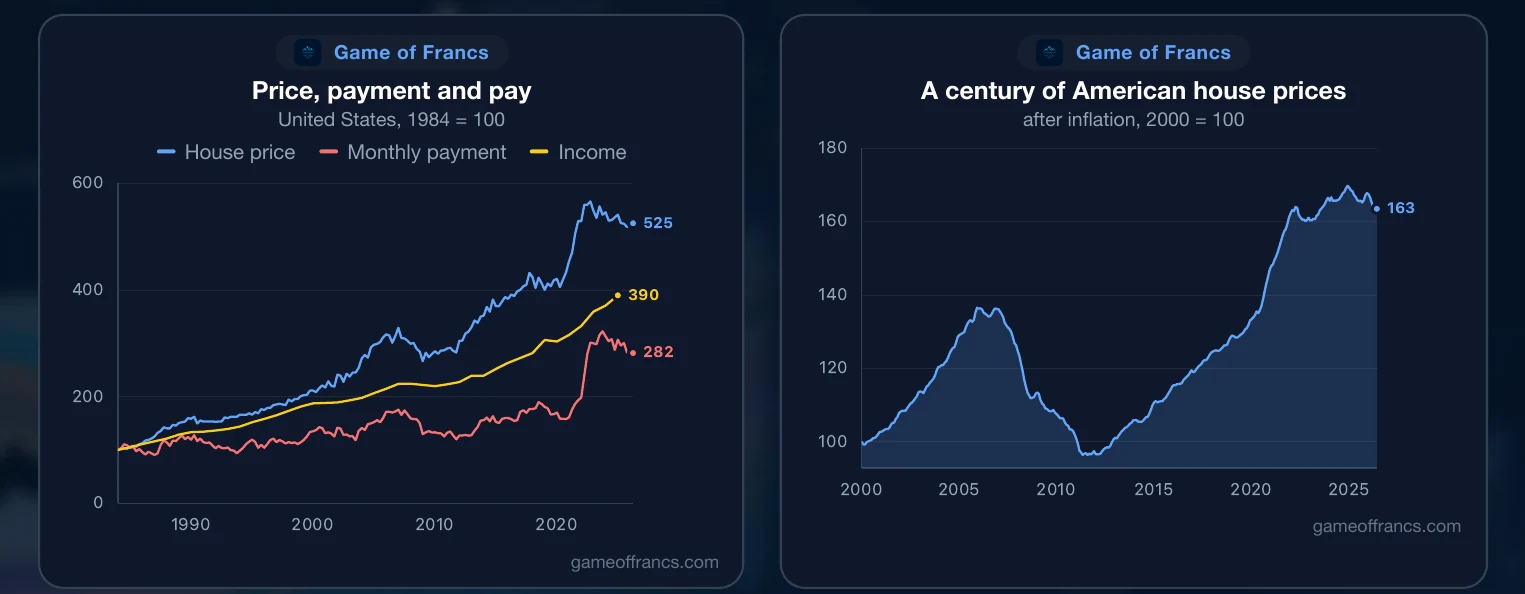
In 1984 the median new American house cost about three and a half times the median household's income. By the end of 2022 it cost almost six. Since then incomes have grown and prices have gone sideways, and the ratio is back to 4.7 — roughly where it stood in 2004, and above every year before that.
A caution that matters more than it sounds. This ratio has to be nominal over nominal: a price in today's dollars divided by an income in today's dollars. Divide a nominal price by an inflation-adjusted income and the early years come out absurdly low — 1.3 for 1984, when the true answer is 3.6 — and the whole line tilts. The published series is built the correct way here.
So prices did outrun pay, by roughly a third of a year's income per decade. Higher, clearly. But not the vertical line the phrase "housing crisis" suggests, and nothing like enough on its own to explain why a house feels out of reach.
IV. The Price of Money
Because almost nobody buys a house with income. They buy it with a loan, and the cost of that loan is where the real movement happened.
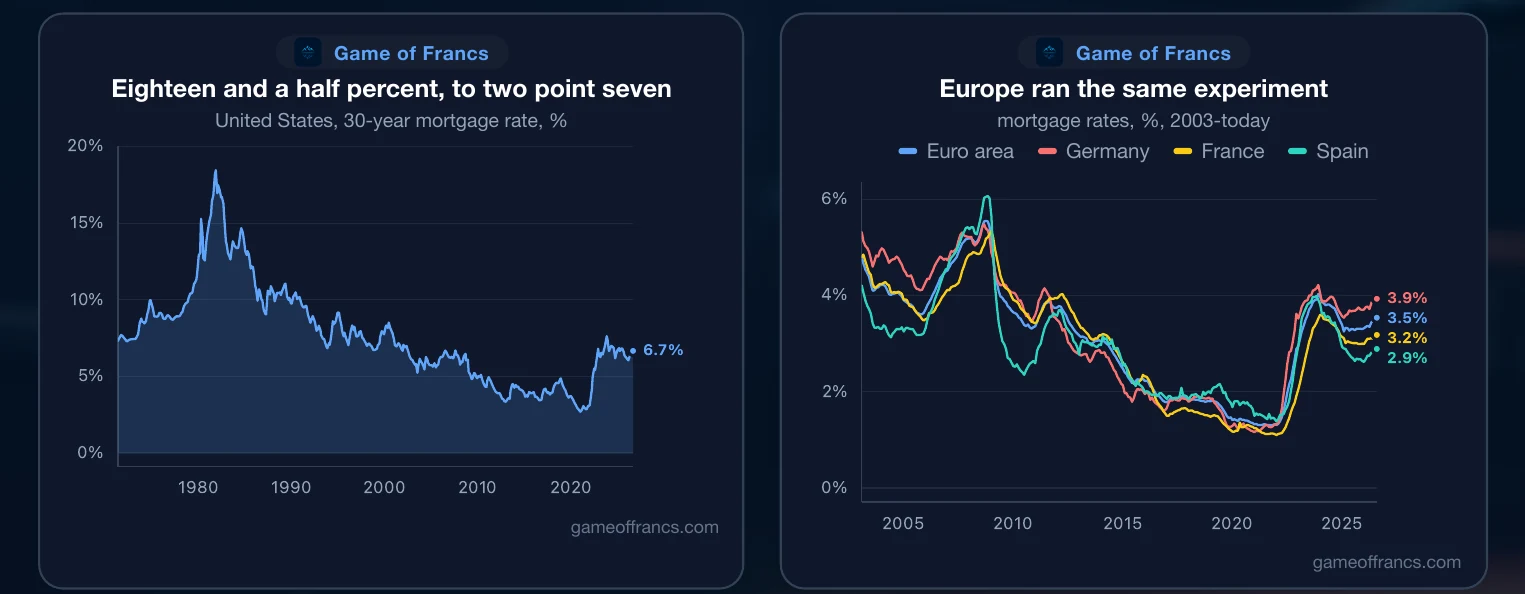
In October 1981 the average thirty-year American mortgage rate reached 18.45%. For the next forty years it fell, almost without interruption, to 2.68% at the end of 2020. Europe ran the same experiment in its own currency: the average euro-area mortgage rate fell to 1.3% in 2021.
Every time the rate fell, the same monthly payment could carry a bigger loan. And a bigger loan, offered to every buyer at once, does not make houses cheaper — it makes them dearer. Falling rates did not reduce the cost of housing. They were converted into higher prices.

V. The Payment
Put price and rate together and you get the number a family actually faces: the monthly payment.
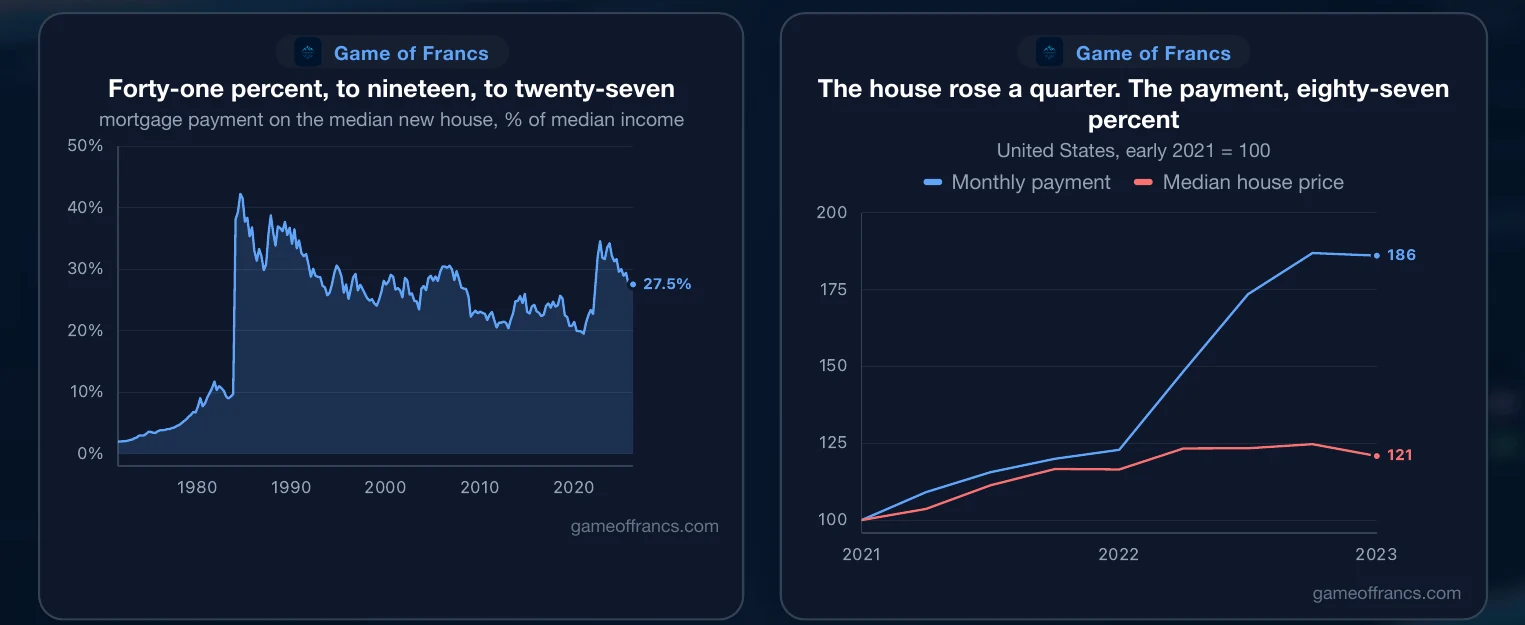
On a median new house, with a fifth paid down and a thirty-year loan, that payment took 41% of median household income in 1984. By the start of 2021 it took under 20%, the cheapest in the whole record — and that was precisely the moment prices were rising faster than at any time since the 1940s.
Then the rate turned. Between the start of 2021 and the end of 2022 the price of that median house rose by a quarter. The payment rose by 87%, from $1,150 a month to $2,148. By late 2022 it was taking nearly 35% of income. The house had barely changed. The money had.
Today it sits near 27.5%: worse than the decade of cheap money, and far better than the 1980s. The honest answer to whether housing is unaffordable is that it depends almost entirely on which interest rate you are comparing it with.
 United StatesIncome
VI. What a Low Rate Creates
Behind every cheap rate is the thing it produces: debt.
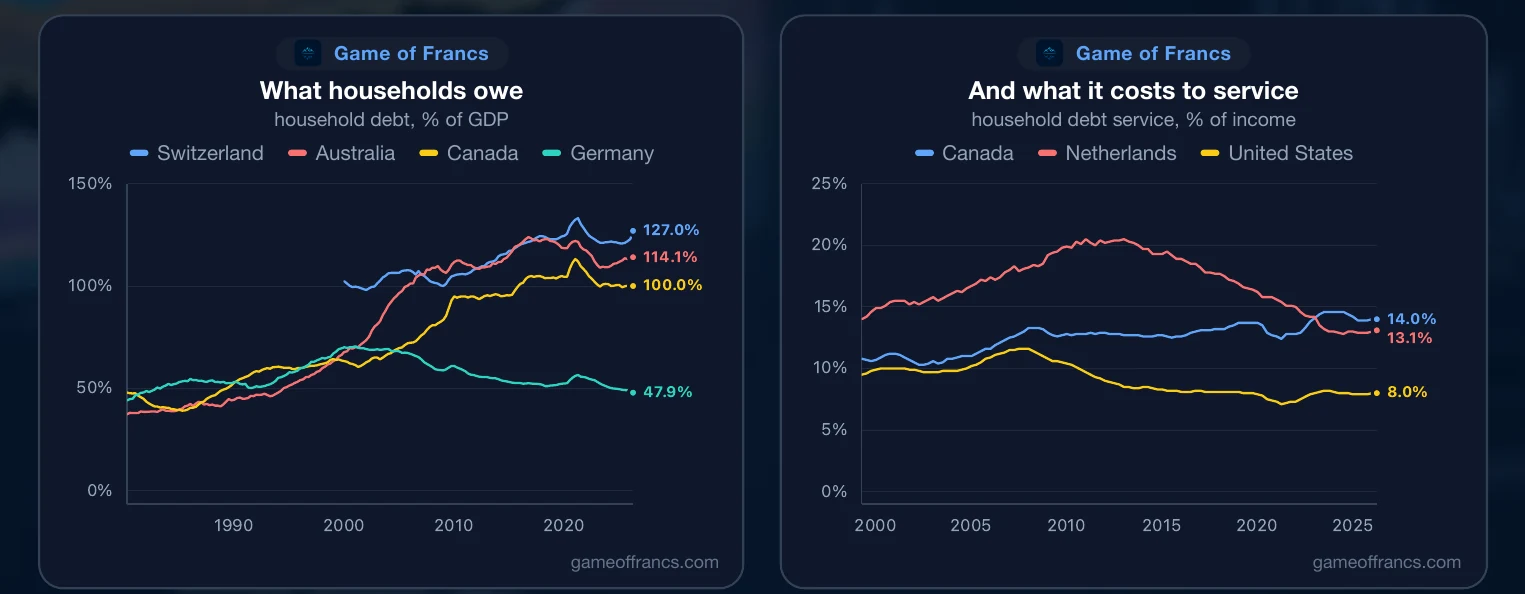
Swiss households owe 127% of their country's annual output. Australians owe 114%, Canadians 100%, the Dutch 95%. Germans owe 48% and Italians 36%. It is not an accident that the countries whose households borrowed most are among those whose prices rose furthest. Credit is not a side effect of expensive housing. It is the mechanism by which housing becomes expensive.
And debt has to be serviced. Canadian households now spend 14% of their income on interest and principal, after touching 14.6% in 2023, the highest in the record. Dutch households once spent more than 20%, in 2010, before a long unwinding brought them to 13%. The Americans, who were at 11.6% in 2007, now pay 8%.
VII. Stretching the Loan, and What Stopped Being Built
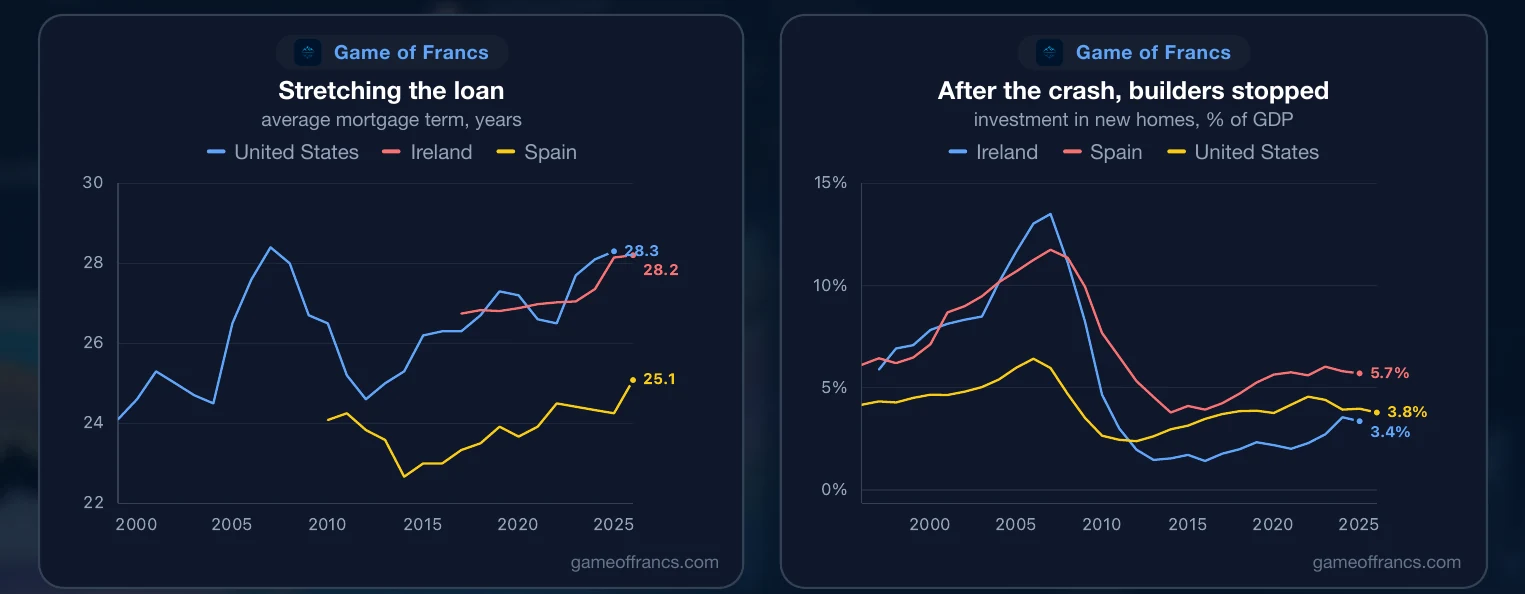
When the payment gets too heavy, there are two levers. The first is time: the average American mortgage now runs 28 years, up from 24 in 1998. In Ireland it has lengthened to 28. In Spain it reached 25 years last year, the longest on record. A longer loan lowers the payment today and raises the total paid over a lifetime. It is affordability borrowed from the future.
The second lever is supply, and it moves slowest of all. In 2006 Ireland spent 13.5% of its entire economy on building homes. Nine years later it spent 1.4%. Spain went from almost 12% to under 4%. America's housebuilding fell from 6% of output to under 2.5%. After the crash, builders simply stopped.
The consequence took a decade to arrive. A country that stops building in the 2010s has a shortage in the 2020s. Irish house prices, after inflation, have more than doubled since 2012. The bust did not end the boom. It planted the next one.

VIII. Prices Can Fall
Which brings us to the question almost nobody asks during a boom.
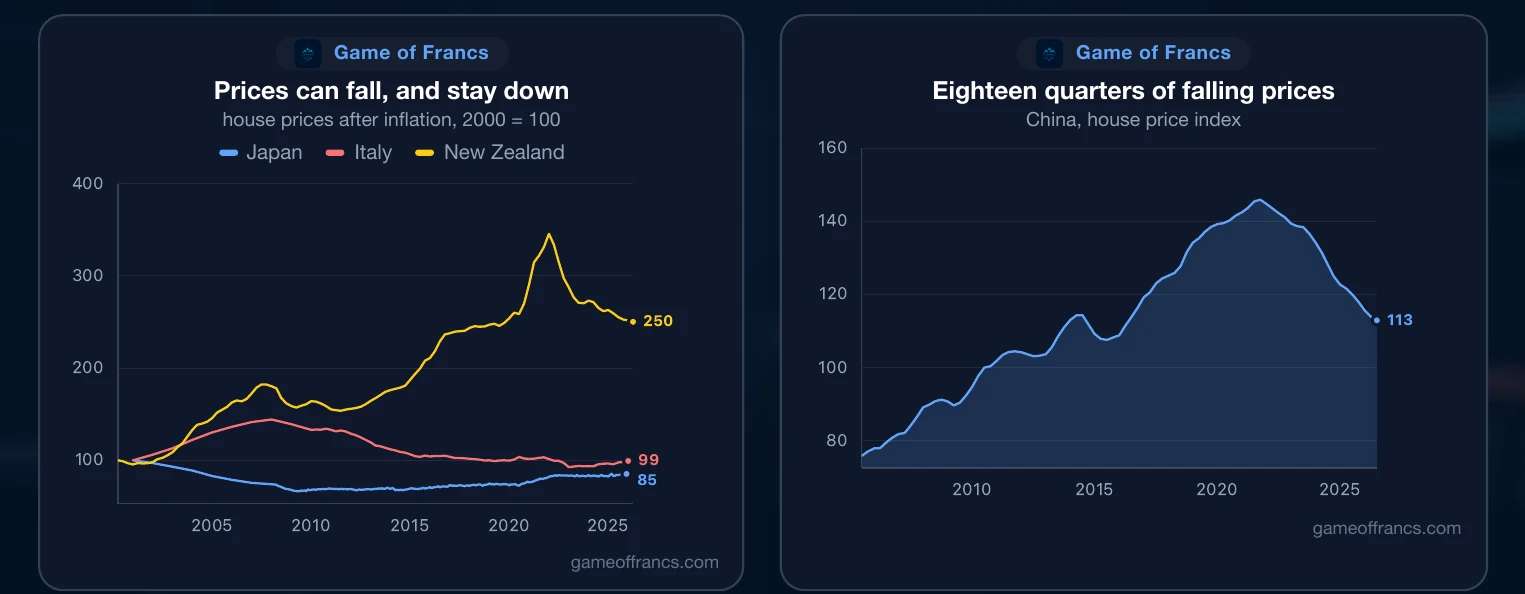
Japan's prices peaked in 1991 and, after inflation, are still a third below that peak. Italy's are 31% below 2007. New Zealand's fell more than a quarter in real terms from their 2021 high. And in China, prices have fallen for eighteen consecutive quarters, down 22% from their 2021 peak.
A house is not a one-way bet. It only looks like one in the countries where the bet has not yet been tested.
 WorldPrices
IX. Who Ends Up Owning
All of this decides who owns and who rents.
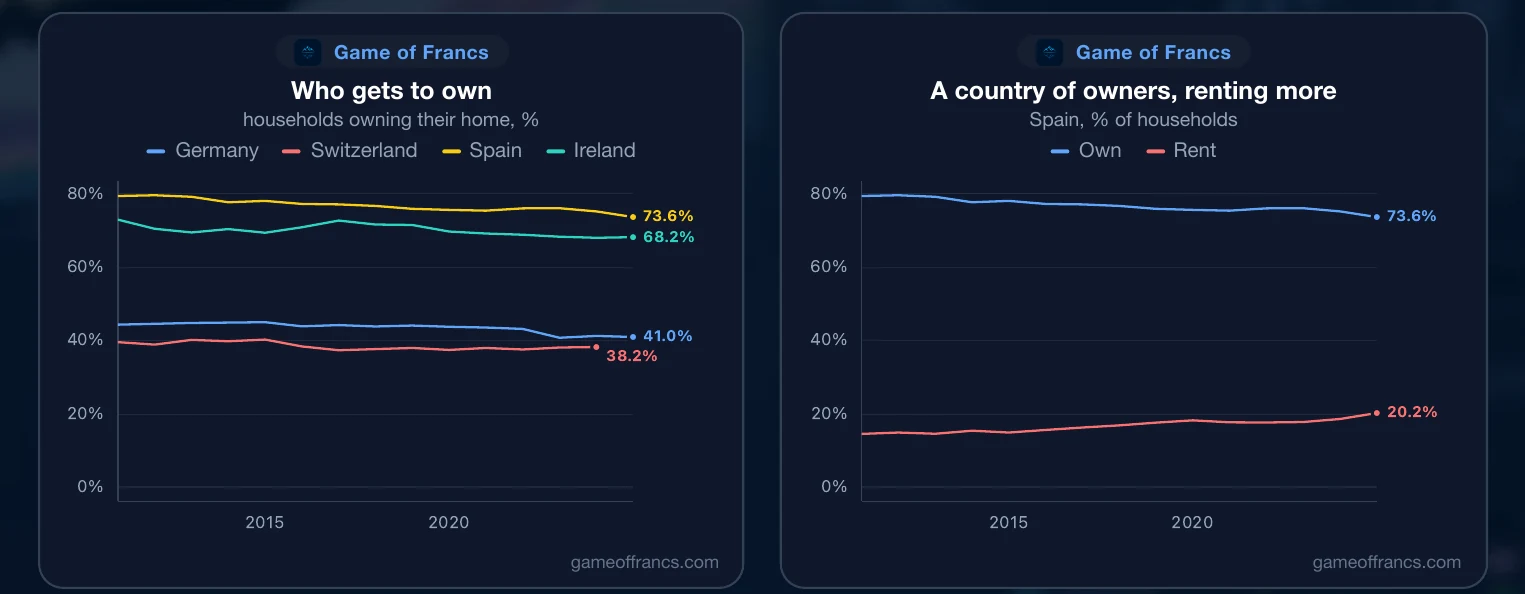
In Germany, Europe's largest economy, 55% of households rent and 41% own. In Switzerland, one of the richest countries on earth, 38% own. These are not failures; they are systems built around renting. But the direction of travel elsewhere is one way. Spain was a country of owners at nearly 80% of households; that share is 74% and falling, while the share renting has climbed from 15% to 20%. In Ireland ownership has slipped from 73% to 68%.
As prices climbed, the ladder did not disappear. It moved further from the ground.

X. The Arithmetic
A house costs its price, multiplied by the rate on the loan, divided by the income that pays it. For forty years the rate did almost all the work: it fell, prices rose to absorb it, and debt rose to fund it. When the rate turned in 2022, prices mostly did not fall. Payments did the adjusting instead.
That leaves three ways back, and only three. Rates fall again — which history says will mostly be converted into higher prices, as it was every other time. Incomes catch up, which is happening, at the pace of a pay rise. Or countries build, which takes a decade and requires the one thing a boom never has: patience.
Housing did not become unaffordable because houses changed. It became unaffordable because money did.
 United StatesGDP
Get the next article by email
One email when a new piece is published. Nothing else, and one-click unsubscribe from any message.