
#11 - A World in Debt
Debt is not a quantity of money. It is a claim on production that has not happened yet — and every claim was made possible by a price. When the price of time is held below what savers would freely have accepted, the economy is told it can afford commitments no one has released the resources to meet. The world now owes $265 trillion.
by Game Of Francs Research Team

I. The Number That Means Nothing
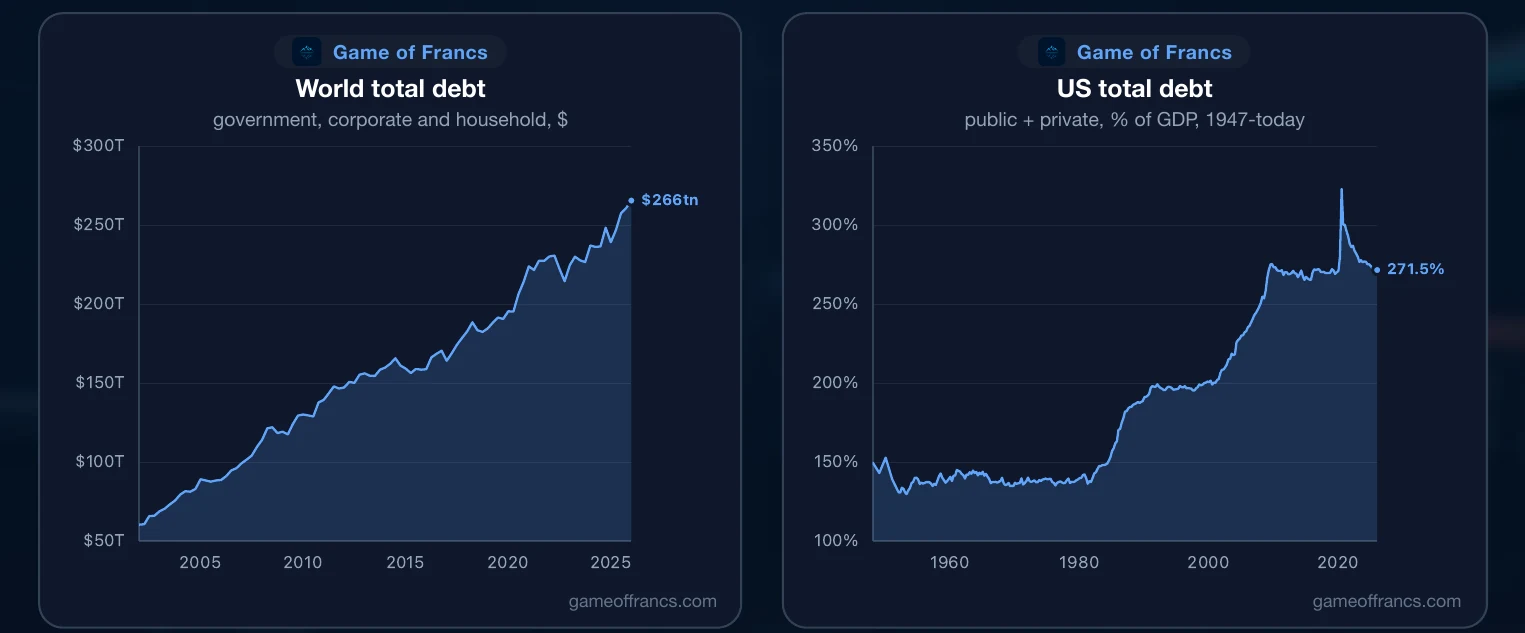
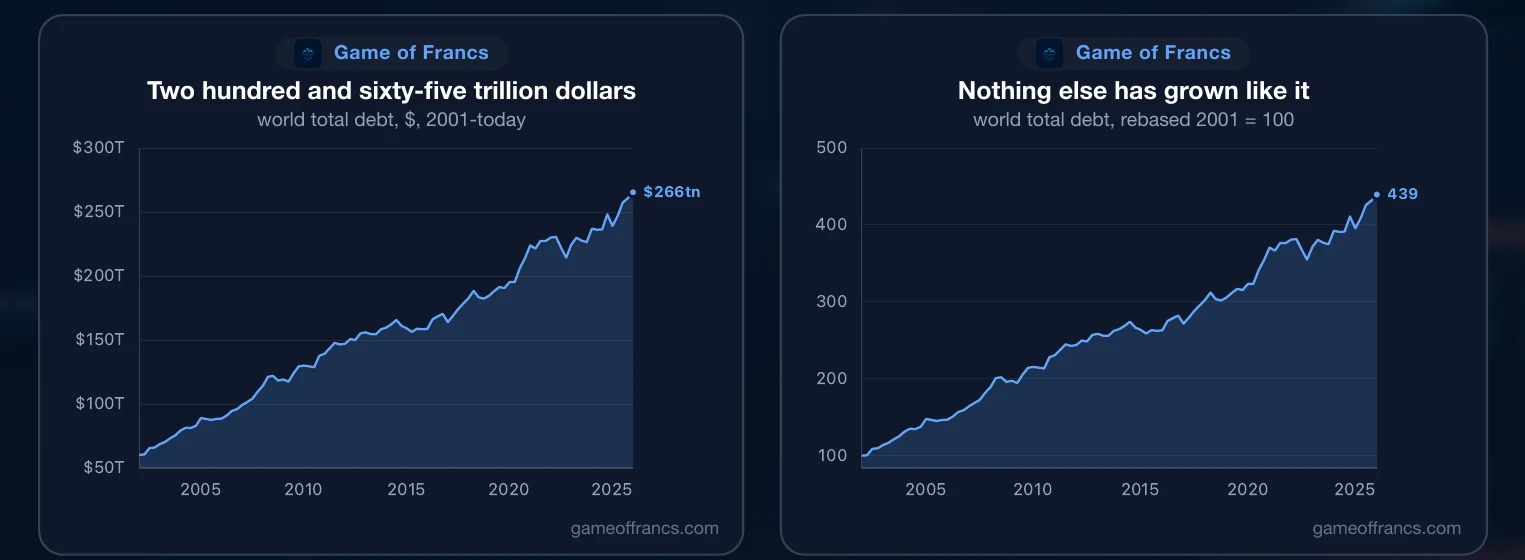
Two hundred and sixty-five trillion dollars. That is what the world owes — governments, companies and households together, across the major economies the Bank for International Settlements tracks. At the end of 2001 the same measure was $60 trillion. It has more than quadrupled in a quarter of a century, and nothing else in the world economy has grown like it. Not output, not population, not trade.
It is a spectacular number, and on its own it settles nothing. What matters is what the number represents. Every one of those dollars is a promise that goods and services not yet produced will be handed over later. Debt is not wealth that exists somewhere; it is an arrangement about the future, and the future has to actually arrive and be productive enough to honour it.
That arrangement is only ever made on terms — and the terms are a price. A borrower commits to a distant repayment because someone quoted him a rate at which doing so looked sensible. That rate is supposed to carry information: it is what savers, in aggregate, demand for postponing their own consumption. When it is discovered rather than announced, it is a genuine signal. A low rate then means real resources — labour, materials, capacity — have actually been released from producing for today, and the projects that rate encourages can in fact be completed.
Suppose instead the rate is set. Suppose it is pushed below the level that people's actual willingness to save would have produced. The signal still travels perfectly; every borrower in the economy still learns that the future has become cheap. But nothing was saved, so the resources are not waiting. Commitments are made that the economy has not the means to complete, and it will go on making them for as long as the price says it can afford to.
That is what a debt total measures. Not recklessness, not greed, not a moral failure of borrowers — but the accumulated residue of a price that told everyone the same untrue thing for four decades. Which is why the honest question is not *when will it be repaid*. It will not be, in the same sense that a company's balance sheet is not repaid: sovereign debt is rolled, corporate debt refinanced, mortgages extended. The question is what it costs to carry these claims, and what happens to the arrangement when that cost changes while the claims do not.
II. Two Halves, One Conversation
Split the total in two, because the word "debt" hides more than it reveals.
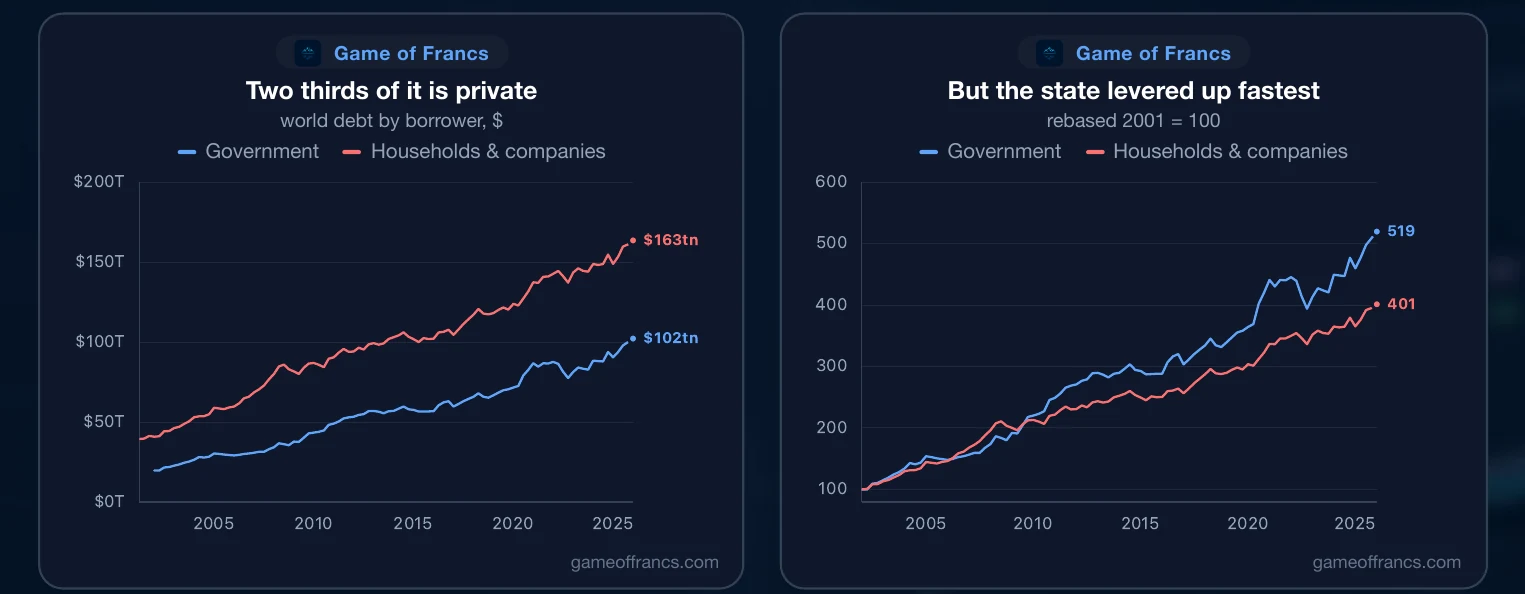
Roughly $102 trillion of the world's debt is owed by governments. Roughly $163 trillion is private — owed by companies and by households. Most of the world's debt has never been sovereign, and most public commentary is about the smaller half. The deficit is a political object; the mortgage book is not.
But the government share is the one that has grown fastest. It stood under $20 trillion at the end of 2001. It has multiplied more than fivefold since, while the private half roughly quadrupled. Two things happened at once: the state took on debt at a pace no household could match, and it did so precisely when the private sector, in several major economies, was going the other way.
That divergence is the most under-reported fact in the whole dataset, and we will meet it again in the United States, in Korea, and in reverse in Australia and Canada. Aggregate figures conceal it completely. A world total that rises by 4x can be composed of a state levering up by 5x while its households pay down — and those are not the same economy, do not carry the same risk, and do not resolve the same way.
III. The Shape of the Whole Thing
There is a third way of seeing it, and it has the longest clean record: total debt in one country, public and private together, measured against the economy that has to service it.
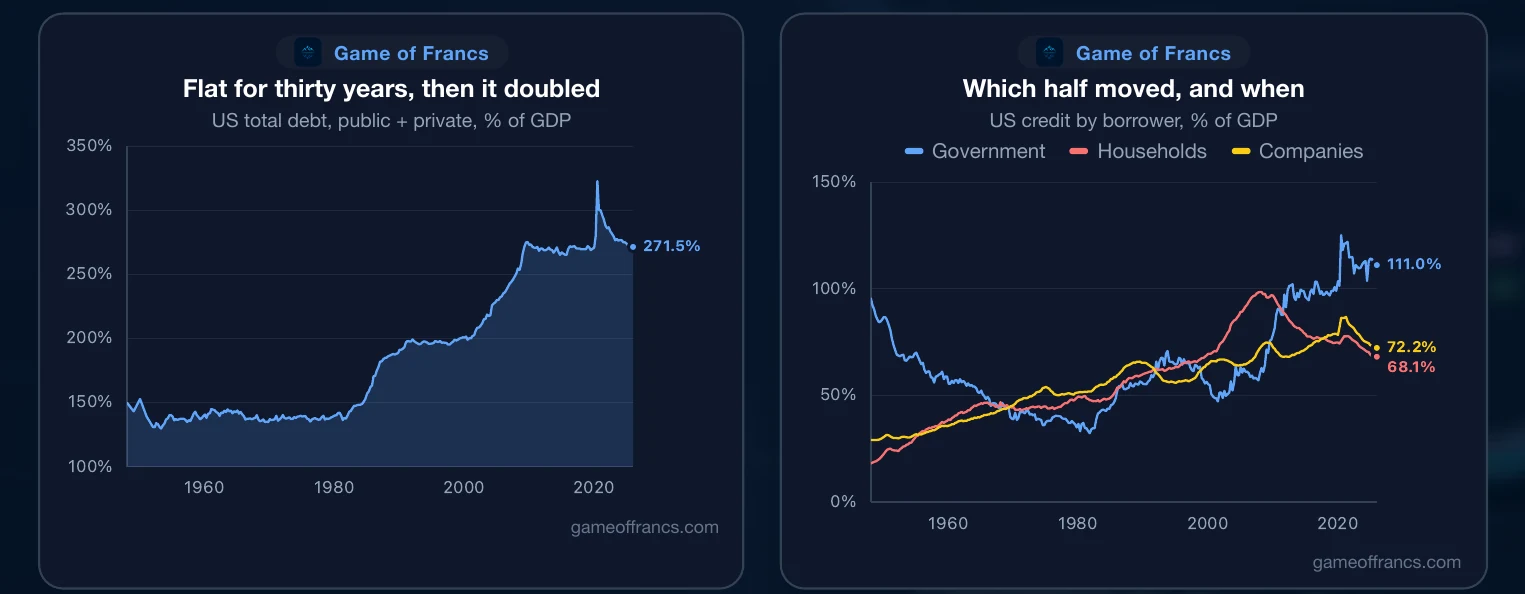
Total American debt — government, companies and households — was 139% of GDP in 1950. Thirty years later, in 1980, it was 140%. An entire generation of American economic life, containing the post-war boom, Bretton Woods, the Great Society, Vietnam and the oil shocks, and the ratio did not move.
Then it doubled. It reached 200% by the year 2000, 266% by the end of 2008, and it has hovered near 270% ever since. It is 272% today.
That is the shape of the entire story, and it is worth sitting with the flatness of the first half. For thirty years an economy that was growing, industrialising and fighting wars did not accumulate claims on itself any faster than it produced. Then it did — and the turn coincides precisely with the decades in which the price of time began its long descent.
This is not a coincidence, and it is the mechanism the rest of this piece keeps running into. The quantity of debt an economy carries is not chosen by borrowers. It is permitted by a price. Lower that price and the same income supports a larger claim; lower it for long enough and the stock expands to fill exactly the space the rate has created. Nobody has to decide to borrow more. They only have to respond, individually and sensibly, to the terms they are quoted.
What that produces is not simply "more debt". It is a different economy — one whose capital has been committed on the assumption that the future is cheap, and which cannot easily be reorganised if that assumption is withdrawn. The ratio doubling from 140% to 270% is the visible trace of a very large number of long-dated commitments made against savings that were never set aside.
IV. The Stock Is Not the Problem
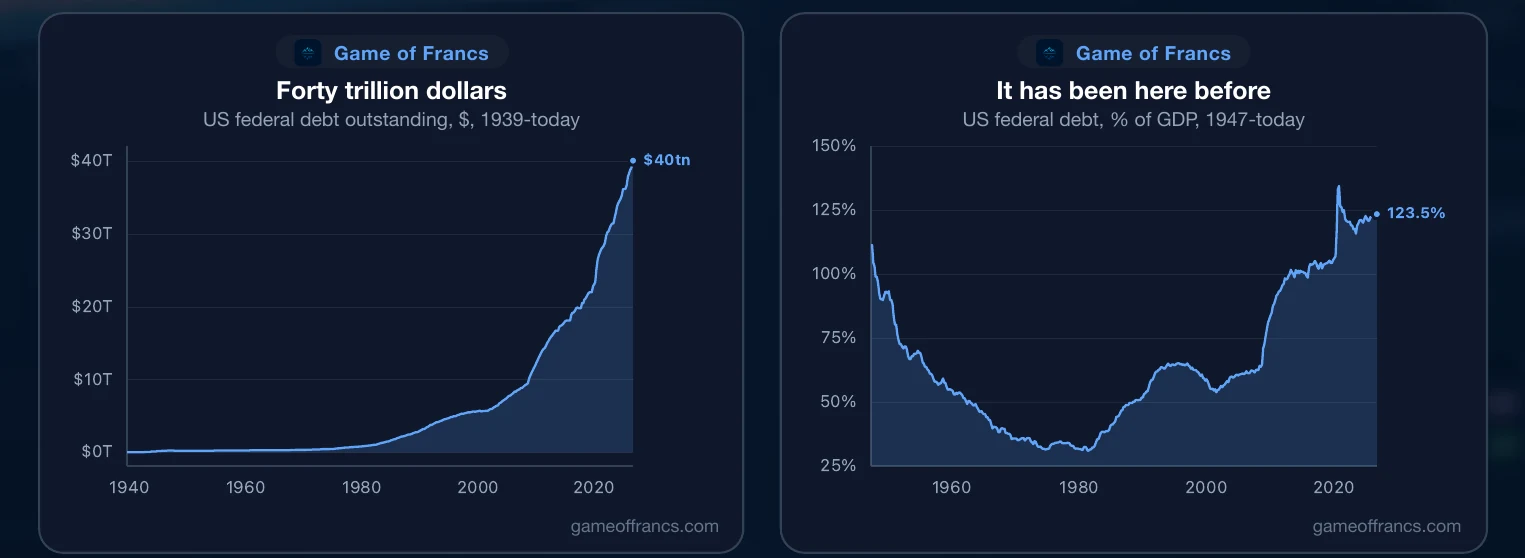
The largest borrower is the United States. Federal debt outstanding is now around $40 trillion. It was under $1 trillion in 1980. It crossed $10 trillion in the autumn of 2008, and reached nearly $28 trillion by the end of 2020.
Measured against the size of the economy it tells a completely different story, and the difference is the point.
Federal debt was 111% of American output in the first quarter of 1947 — the bill for the Second World War. Thirty-five years later it was 31%, the lowest reading in the series. Everything since has been the climb back: a peak near 126% at the end of 2020, and 123% today.
So the United States has carried this before. The interesting question is how it got out, and here the popular answer is wrong. It did not grow its way out. Between 1947 and 1981 the ratio fell by roughly three-quarters, and inflation did most of that work — a sustained erosion of the real value of a fixed nominal debt, helped by a long stretch in which the rate paid on that debt sat below the rate at which prices were rising. Growth contributed. It was not the main instrument.
That distinction decides whether the precedent is comforting. If the debt was inflated away once, the precedent is not "America grew out of it and can again". The precedent is that the holders of American debt absorbed a large real loss over three decades, quietly, without a default being declared. That is a solution. It is simply not a painless one, and it is not available to every borrower in this piece — as Greece will demonstrate.
V. The Bill
The number that decides whether the United States can do it again is not the stock. It is the bill.
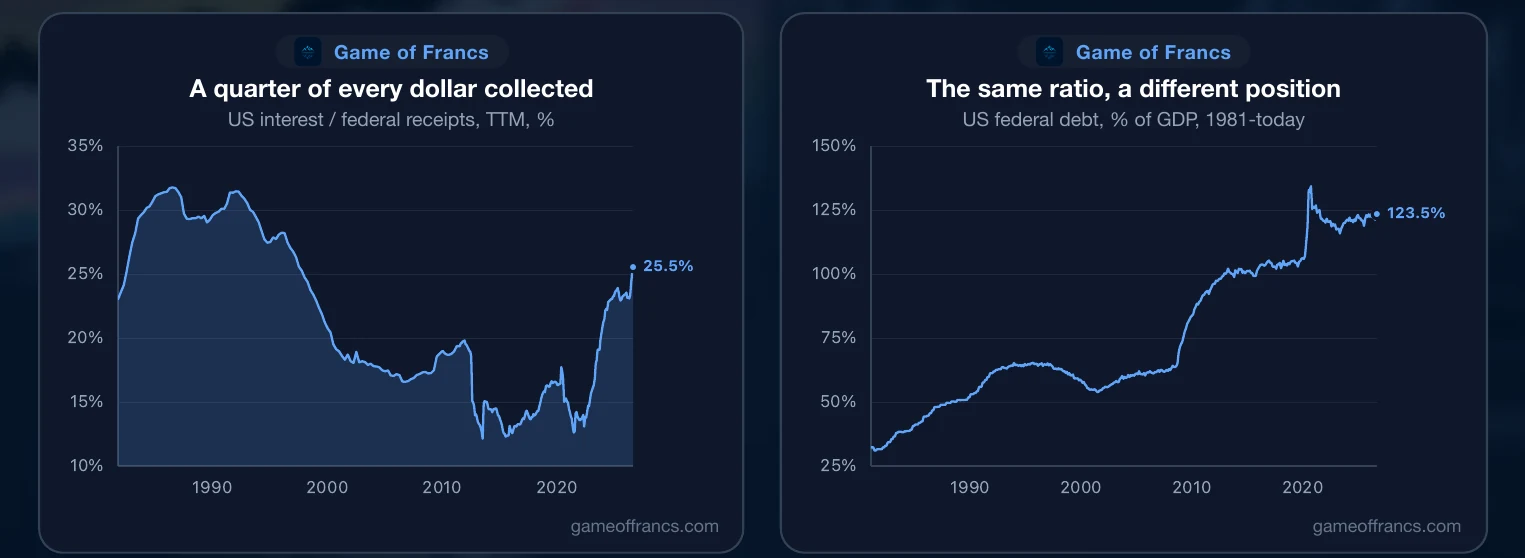
Interest now absorbs about a quarter of every dollar the federal government collects in revenue — 25.5% on a rolling twelve-month basis. That is not a record. In mid-1986 the same measure reached almost 32%, and the republic did not end.
The difference is what sat underneath. In 1986, federal debt was 45% of GDP, barely a third of today's level, and the direction of interest rates was down — the beginning of a thirty-five-year bull market in bonds that would keep making the same debt cheaper to carry every year. Today the debt is three times larger relative to the economy, and the direction of rates is up.
This is why the ratio alone misleads. The same 30% of revenue means one thing when it is about to fall for a generation and something else entirely when it is about to rise. In 1986 the interest bill was a problem being solved by the bond market. Today it is a problem the bond market is adding to.
The mechanism deserves stating plainly, because it is the engine of this entire piece. A government does not repay its debt; it refinances it. Each year a slice matures and is reissued at whatever the market charges *that day*. The stock can be completely unchanged and the average rate paid on it will still creep upward, one maturity at a time, until the interest bill reflects today's price rather than yesterday's. Nothing has to go wrong for this to happen. It is arithmetic, and it runs whether or not anyone decides anything.
VI. The Household Exception
The American private sector went the other way, and this part usually gets left out.
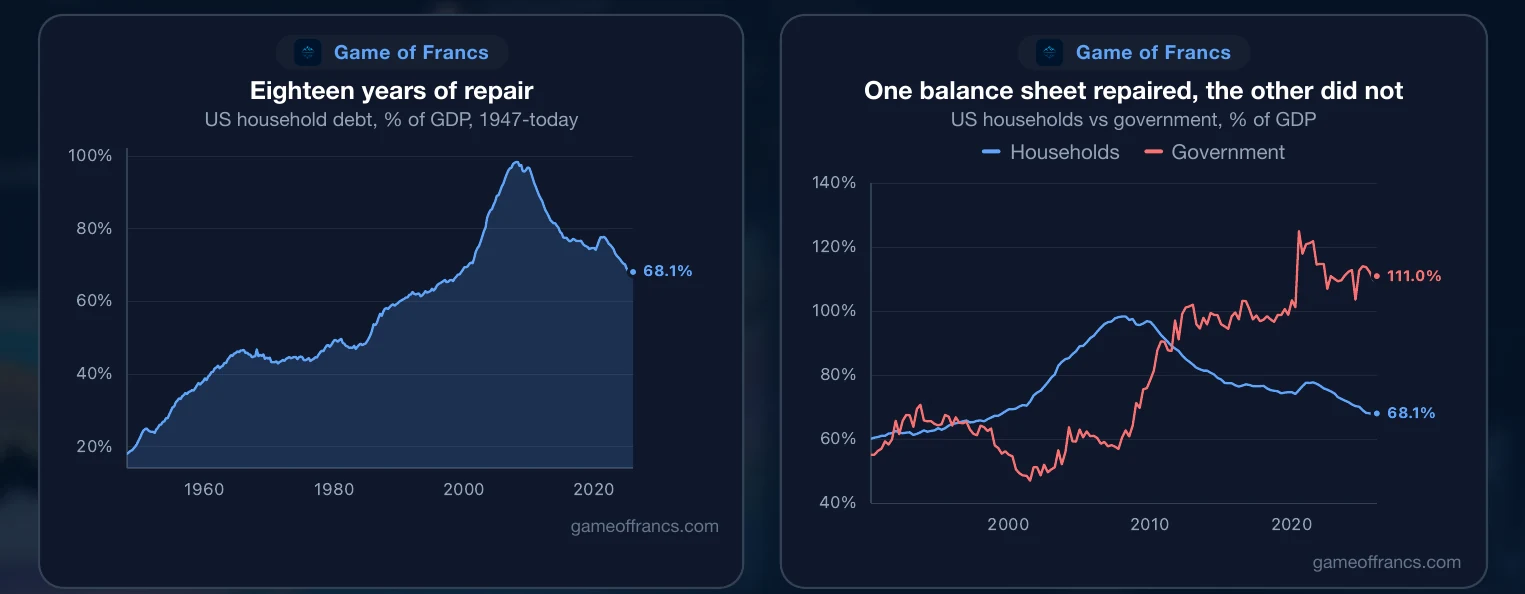
Household debt peaked at 98% of GDP at the end of 2007. Then came the foreclosure crisis and the better part of two decades of repair. It is 68% now. American households spent eighteen years reducing their leverage while their government roughly tripled its own.
This matters for two reasons. First, it means the American debt problem is a *public* problem, not a general one — the balance sheet that is stretched is the state's, and the household sector is in better shape than at any point since the early 2000s. Second, it is a demonstration that deleveraging is possible. It is slow, it is politically miserable, it took a housing collapse to start it, and it took eighteen years. But it happened, in the largest economy in the world, within living memory.
Set that against the countries in Section IX, where household debt has never meaningfully fallen, and the American experience starts to look less like a warning and more like the only completed example of the thing everyone else still has to do.
VII. Japan: Where Cost Is Everything
Japan is the extreme case, and it has been the extreme case twice.
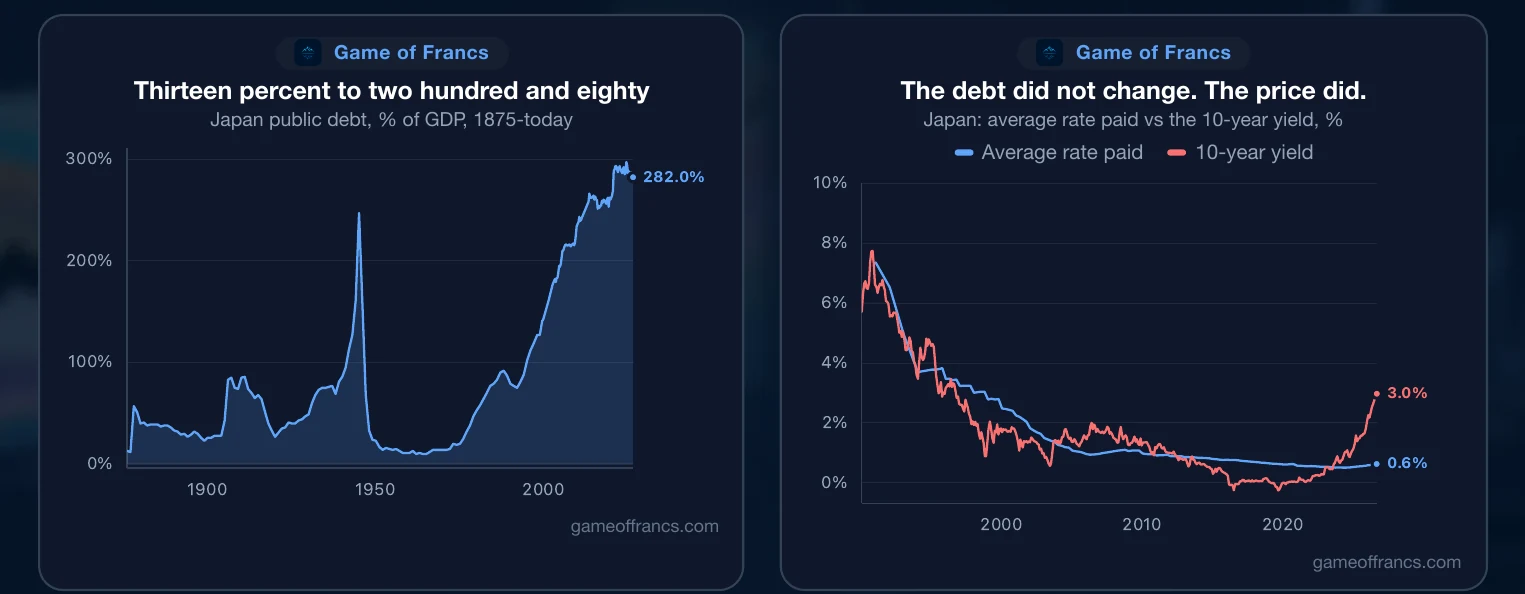
Government debt is around 282% of GDP, the highest in the developed world. In 1875 it was 13%. It reached 247% in the last full year of the Second World War, and inflation and defeat then erased almost all of it — 17% by 1950. The second climb began from 77% in 1990 and has run for thirty-five years without a meaningful reversal.
Why is that survivable? Because of what it costs. The average interest rate Japan actually pays across its entire debt stock is around six-tenths of one percent. In 1980 it was over 9%. A debt of nearly three times national output, carried at almost no coupon, is a problem that can be deferred more or less indefinitely — and Japan has deferred it for a generation, through repeated predictions of imminent crisis that never arrived.
Which makes the following the most important number in this piece. The Japanese ten-year government bond yielded *less than zero* as recently as 2016, and near zero at the end of 2021. It is now close to 3%, the highest since 1996.
Japan still pays six-tenths of one percent. What has been repriced is everything it has yet to refinance.
That distinction is the whole argument in one country, and it is worth being exact about it, because the tidy version — *the debt didn't change, the price did* — is not true. The debt changed enormously: 77% of GDP in 1990, 282% now. And the price Japan actually pays has not changed at all; it is still 0.62%, the lowest in its modern history.
What changed is the price of the next roll. A government does not repay its debt, it refinances it, so the market's new terms reach the interest bill only as the old bonds mature and are reissued — one slice a year, at whatever is being charged that day. Japan's average rate is 0.62%. Its ten-year is 2.97%. Neither number is a forecast; the gap between them is simply a cost that has been incurred and not yet delivered.
That is what makes Japan the clearest case in this piece. Nothing has gone wrong there. No crisis has been declared, no auction has failed. A price moved, and the consequences of it are arriving on a schedule set by the maturity structure — slowly enough that it will never be a headline, and inexorably enough that it does not need to be.

VIII. China, Compressed
China's debt is not primarily the government's.
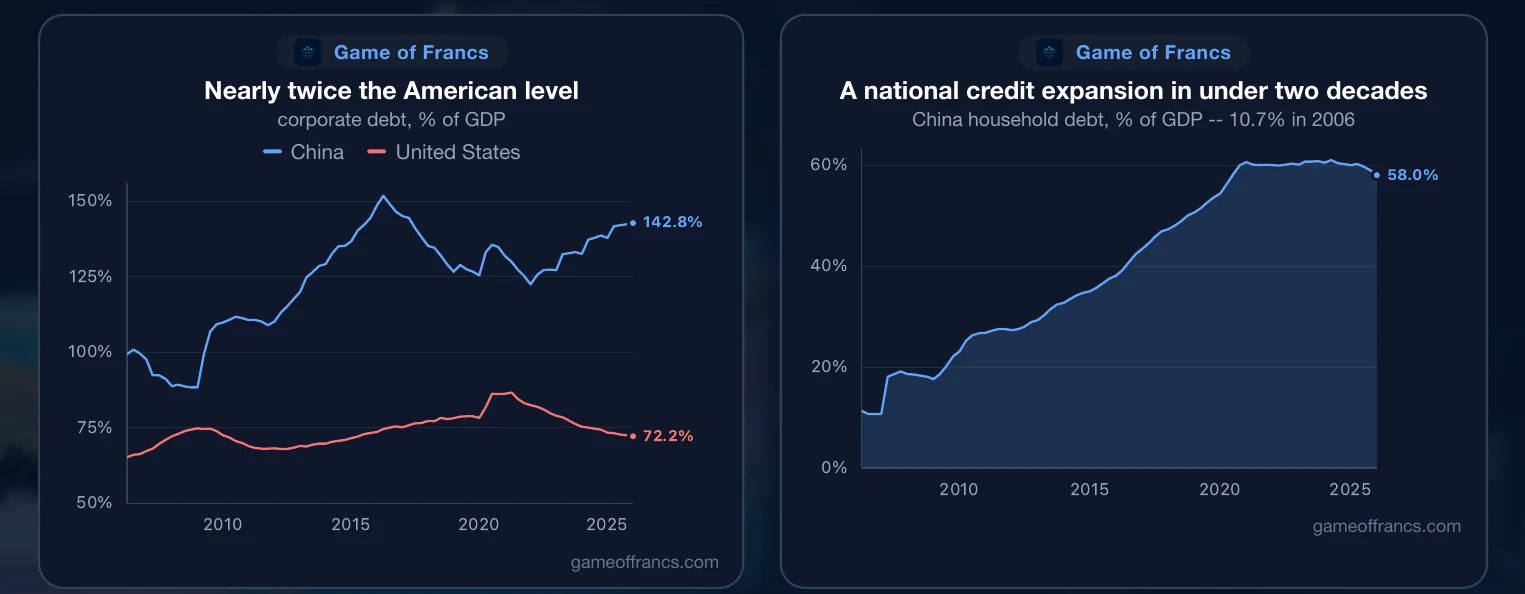
Chinese corporate debt runs around 143% of GDP — nearly twice the American level of 72% — and it includes the local-government financing vehicles that built the country's infrastructure. It peaked above 150% in 2016, and a decade of deleveraging campaigns has barely moved it.
Chinese households borrowed faster than any large country in modern history. Household debt was 10.7% of Chinese GDP in 2006. It reached 61% by early 2024, and stands at 58% now. That is an entire national credit expansion — the kind that took the United States sixty years and Korea forty — compressed into under two decades, and almost all of it is mortgages.
The price of Chinese debt now tells the story Japan's told thirty years ago. The Chinese ten-year yield was 4.7% in 2013. It is 1.7% today.
That is not confidence. A government bond yield is the market's forecast of growth and inflation over the life of the bond, and 1.7% for ten years is a forecast of a long stretch of very little of either. China is not being rewarded for good behaviour with cheap money. It is being priced for the thing Japan has had since 1990.

IX. One Currency, Several Prices
Europe is where the mechanism becomes visible institutionally, because the euro removed every adjustment channel except one.
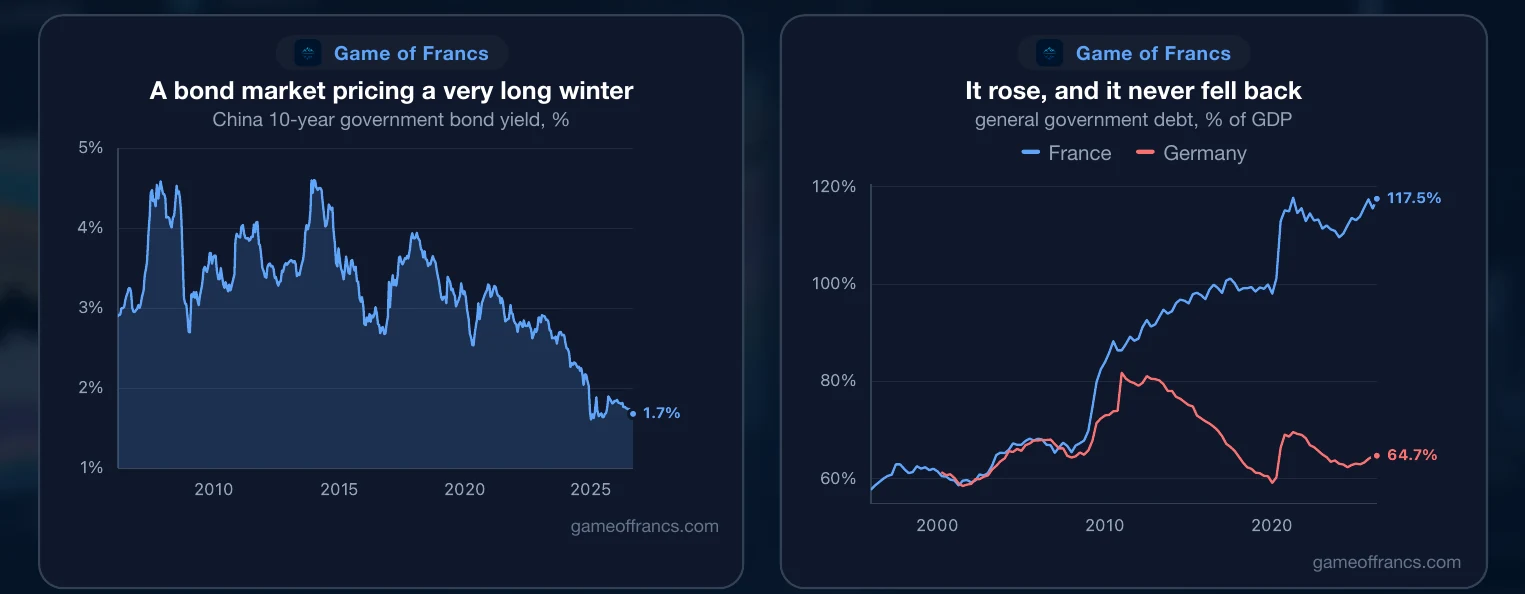
**France** carries the heaviest load of the large European economies — around 118% of GDP, against 58% in 1995. It doubled in thirty years, and unlike almost everyone else here, it never fell back after a crisis. It rose in 2009 and stayed. It rose in 2020 and stayed.
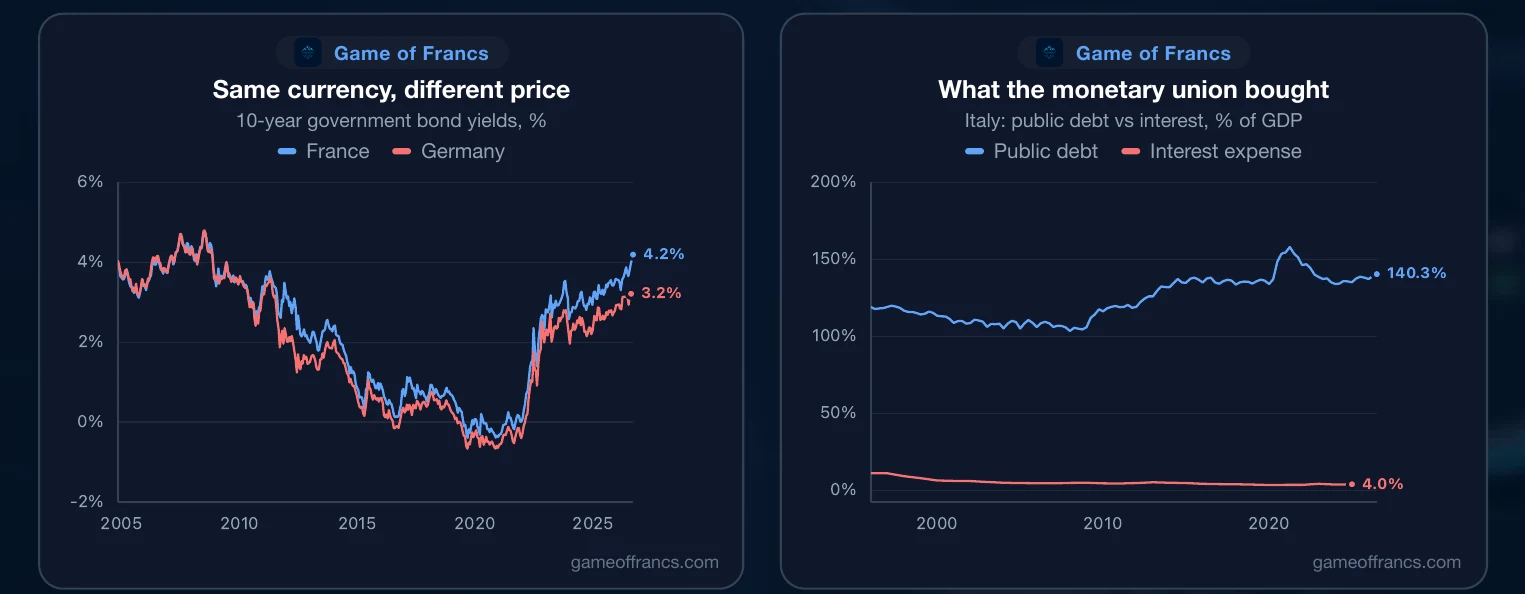
The market has begun to charge for that. France and Germany borrow in the same currency, under the same central bank. Between 2004 and 2008 the gap between what they paid for ten-year money averaged approximately zero. Today France pays roughly a hundred basis points more, and that gap has not closed since 2011.
This is what a currency union does to a struggling member. It cannot devalue — it has no currency of its own. It cannot cut its own policy rate — there is one central bank for twenty countries. The exchange rate and the short rate, the two shock absorbers a sovereign normally has, are both gone. What is left is the spread: the extra yield the market demands to hold French paper rather than German. In a currency union, the spread is the only vote a bond market is allowed to cast, and it casts it every day.
**Italy** owes about 140% of GDP, and no Italian will tell you that is news. It was 119% in 1995, and it has never once been below 103% in the entire life of the euro. What changed for Italy is not the debt. It is the cost of it. Interest on Italian public debt consumed 11.2% of Italian GDP in 1995. It is 4% now. Italy carried roughly the same debt ratio for thirty years while its interest bill fell by two-thirds. That is what monetary union bought — and it is exactly what a sustained rise in European rates would take back.
**Germany** is the exception that makes the rest legible. German government debt is around 65% of GDP. It was 82% in 2010, and Germany brought it down to 59% by 2019 — paying down debt through the years when everyone else was adding it. That restraint is the fiscal space Europe is now arguing about how to spend.
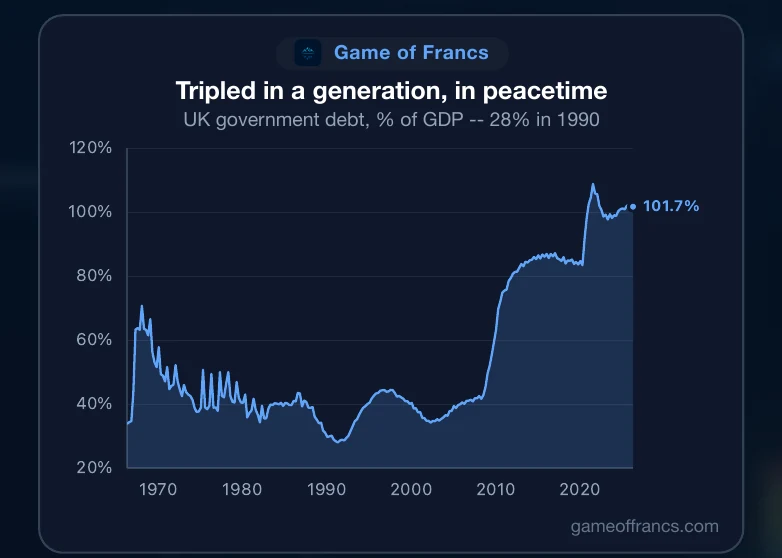
**Britain** shows how fast this can happen. UK government debt is about 102% of GDP. In 1990 it was 28%. On the eve of the financial crisis it was 43%. Britain more than tripled its debt ratio in a single generation, in peacetime, without a war and without a default. Two crises and fifteen years of weak growth were enough.


 United KingdomDebt
X. The Price of Owing
The countries with the largest household debts are not the ones in the headlines.
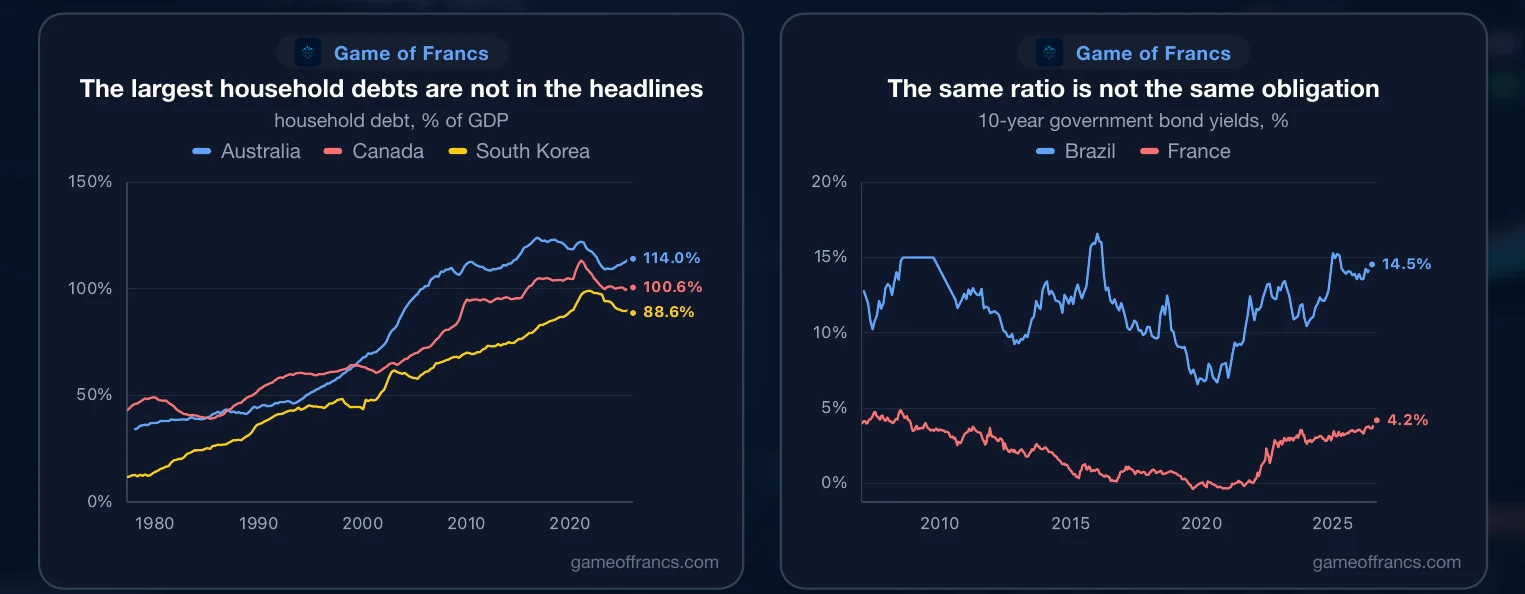
Australian households owe 114% of Australian GDP, against 34% in 1977. There is no mystery about the cause: a housing market financed substantially by variable-rate mortgages, in a country that has not had a serious property downturn in three decades. Canada is the same story with the same cause — just over 100% of GDP, up from 56% in 1990. Both came through 2008 without a housing bust, and both appear to have concluded that they should keep borrowing.
Korea got there fastest, and is the one place going back. Korean household debt was under 2% of GDP in 1962, 48% at the 1997 Asian crisis, and 99% in 2021. It is 89% now, which makes Korea one of the few economies where household deleveraging is genuinely underway.
Everything to this point is about how much is owed. The rest of the world is a lesson in what it costs to owe it.
Brazil's public debt is around 103% of GDP, which is *less* than France's. Brazil pays around 14.5% on its ten-year bond. France pays about 4.2%. The same ratio, at that rate, is not the same obligation — it is not even the same kind of object. India shows the arithmetic from the other side: Indian public debt is about 75% of GDP, modest by the standards of this piece, yet India spends over 5% of its entire economic output on interest — more than the United States does, on a debt half the relative size.
Rates, not ratios, are what governments actually pay.
XI. The End of the Road
One country here has already been to the end of this road.
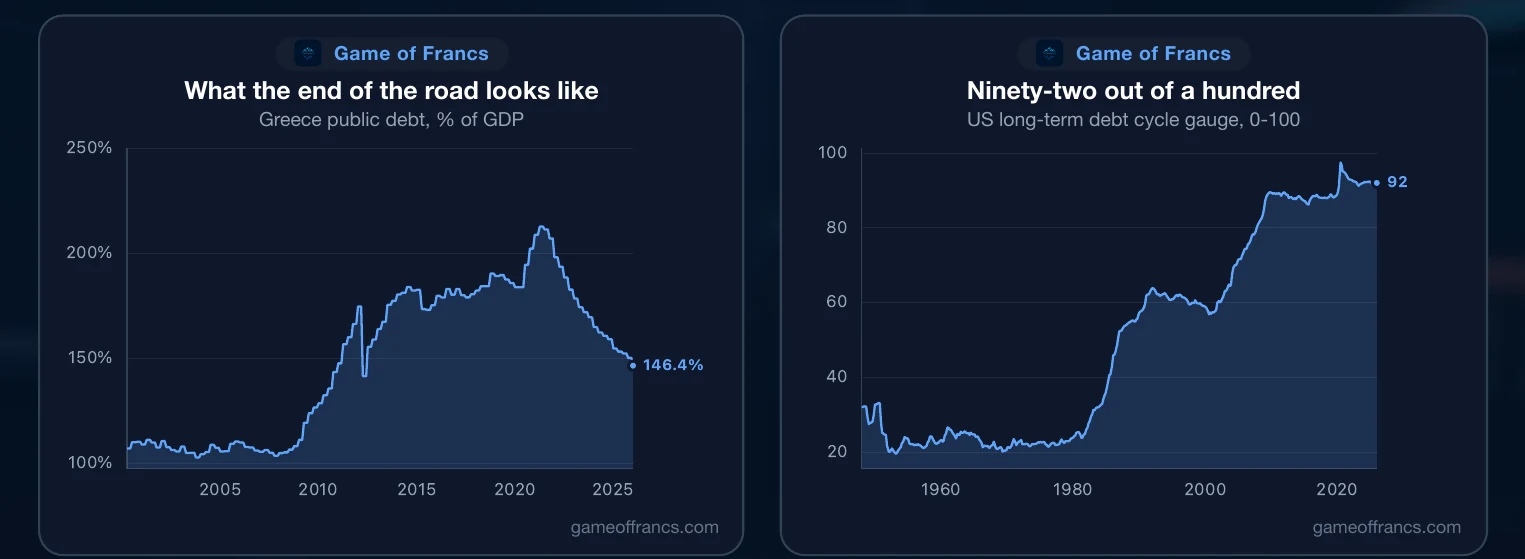
Greek public debt was 105% of GDP in 2007. It reached 175% in 2011 and 213% at its peak in 2021. It is 146% today. Greece got there by defaulting on its private creditors, by a decade of austerity that cost it a quarter of its economy, and by surrendering control of its budget to its lenders.
It is worth being precise about why those were the available options. There are four ways out of a debt that cannot be carried: default on it, shrink the state until the books balance, inflate it away, or grow out of it. Greece did the first two. It could not do the third, because inflating away a debt requires a currency of your own and Greece had adopted someone else's. It could not do the fourth, because austerity was busy removing a quarter of the economy that the growth would have had to come from. Two doors out of four, and the two that were open are the two that hurt immediately.
That is the resolution of a sovereign debt crisis seen from the inside, and it is the single best argument for taking the interest bill seriously long before it becomes the whole conversation.
Which brings us back to where we started. Our long-term debt cycle gauge for the United States reads 92 out of 100. In 1981, when Paul Volcker began, it read 26. The whole world has been living inside a single four-decade credit expansion, and every country in this piece sits somewhere along it — Japan at the far end, India near the beginning, Greece already past it.
It is tempting to read that as a warning about profligacy, and it is not. Almost every borrower in this piece behaved rationally on the terms in front of them. The terms were the problem. A price that is announced rather than discovered does not stop being a price; it simply stops carrying information, and an economy that cannot read the cost of time will accumulate commitments it has made no provision to meet. The stock of debt is what that looks like after forty years.
None of it has to be repaid. It has to be carried — and carrying it means that a growing share of what is produced each year is already promised to someone before anyone decides what to do with it. That is the real constraint, and it does not announce itself as a crisis. It shows up as an interest bill, quietly, one maturity at a time. What that bill costs is the only number here that ever really changes.
 WorldEconomic Cycle
Get the next article by email
One email when a new piece is published. Nothing else, and one-click unsubscribe from any message.